| |
Stratigraphic Maps
Click
here
for MAP LIST.
Click
here
for INTERACTIVE MAP INSTRUCTIONS.
Back to TGI II Home
MAP VIEW - Unit Extent
|
|
Simplified Time Scale
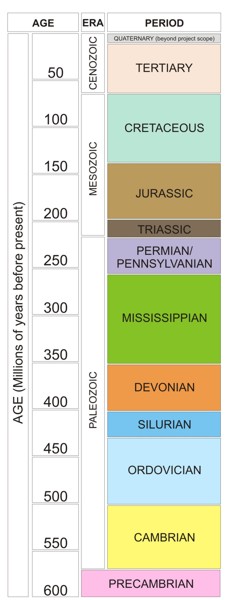
To view an image of the Okulitch Time Scale click
here.
|
|
|
The Stratigraphic Map series
from the TGI II project provides seamless 1:1 000 000 maps of the
project area, including 45 structure maps and 53 isopach maps,
mapping a total of 58 horizons from the Mesozoic and Paleozoic. The
maps were drawn from a database containing a selected list of
formation tops totalling 9012 wells, which included 2606 wells from
Manitoba, 5046 wells from Saskatchewan, 771 wells from North Dakota,
and 589 wells from Montana. Computer-generated structure and isopach
maps for 56 geological horizons, spanning Manitoba, Saskatchewan,
North Dakota and Montana were created. North Dakota and Montana data
are hidden on the final suite of maps, but were used during map
generation to maintain geological accuracy of the contours at the at
the Canada�United States border.
All the maps were computer-generated using ArcInfo� GIS Workstation
(version 9.2). Map specifications are as follows: Universal
Transverse Mercator projection with a central meridian of 101oW;
North American Datum (NAD) 1983. Data points were rasterized as
ArcInfo grids which were then contoured, entirely within the ArcInfo
Workstation environment. Tension spline spatial interpolation was
used to rasterize the structure data and inverse distance weighting
used with the isopach data. In areas with sparse well coverage,
triangulated irregular networks were used in conjunction with the
above techniques. In areas of extremely dense coverage, point values
were first averaged in order to avoid bulls-eyes from anomalous
data. Extrapolated point values were added outside of the data
extents to prevent mathematically anomalous erratic contour
behaviour ("edge-effects"). Finally, raster grids were smoothed
using a focal mean filter in order to avoid jagged contours.
Data Files Data files used to create the maps are supplied for each horizon. The data
file can be downloaded here, and contains the raster file in ArcInfo grid
format, data point shapefiles, contour shapefiles (structure and/or isopach),
and the formation edge shapefiles.
The specialized combinations of spatial interpolation and filtering were
chosen to portray the regional trends of the data at a small scale. As such,
some of the data points may not match the contour values accurately in
places, and it would be difficult to replicate the maps using the TGI
database without the actual modelling script that was developed specifically
for this project. Use of the data files supplied for each horizon is at the
user discretion.
Disclaimer The TGI team was dedicated to maintaining accuracy and consistency in the
picks and information presented, however due to the size of the project,
some errors may have been missed. The TGI team is not liable for these
errors. The user of this information accepts all responsibility for any work
done on their part that uses all or part of this data.
This data is provided free of charge and may be used and
redistributed as long as no fee for the data is charged to third parties.
Please ensure that proper referencing of the source is maintained with data
sent to third parties.
Maps for free
download:
- Cretaceous Belly River Formation (Lower Odanah) (structure and isopach)
- Cretaceous Lea Park Formation (Millwood and Pembina) (structure and isopach)
- Cretaceous Milk River Formation (Gammon Ferruginous) (structure and isopach)
- Cretaceous Niobrara Formation (structure and isopach)
- Cretaceous Carlile Formation (structure and isopach)
- Cretaceous Second White Specks (Favel) (structure and isopach)
- Cretaceous Belle Fourche Formation (structure and isopach)
- Cretaceous Westgate Formation (structure and isopach)
- Cretaceous Newcastle Formation (Viking Sandstone) (structure and isopach)
- Cretaceous Joli Fou Formation (Skull Creek) (structure and isopach)
- Cretaceous Mannville Group (Swan River) (structure and isopach)
- Cretaceous Success Formation, S2 (structure and isopach)
- Jurassic Success (S1) + Masefield Formations (Waskada) (structure and isopach)
- Jurassic Rierdon Formation (Upper Melita)
(structure and
isopach)
- Jurassic Shaunavon Formation (Lower Melita)
(structure and
isopach)
- Jurassic Gravelbourg Formation (Reston)
(structure and
isopach)
- Jurassic Upper Watrous Formation (Upper Amaranth
Evaporite) (structure and
isopach)
- Triassic Lower Watrous Formation (Lower Amaranth Red
Beds) (structure and
isopach)
- Paleozoic Erosional Surface (structure
only)
- Mississippian Erosional Surface (structure
only)
- Mississippian Big Snowy Group (structure and
isopach)
- Mississippian Charles Formation, Poplar Beds (structure and
isopach)
- Mississippian Charles Formation, Ratcliff Beds (structure and
isopach)
- Mississippian Charles Formation, Midale Beds (structure and
isopach)
- Mississippian Charles Formation, Midale Beds, Midale
Evaporite (isopach
only)
- Mississippian Mission Canyon Formation, Frobisher
Beds (structure and
isopach)
- Mississippian Frobisher Beds, Frobisher Evaporite (isopach
only)
- Mississippian Mission Canyon Formation, Kisbey
Sandstone (structure and
isopach)
- Mississippian Mission Canyon Formation, Alida Beds (structure and
isopach)
- Mississippian Mission Canyon Formation, Tilston Beds
(structure and
isopach)
- Mississippian Lodgepole Formation (Souris Valley
Beds) (structure and
isopach)
- Mississippian Bakken Formation (structure and
isopach)
- Devonian Torquay Formation (Three Forks) (structure and
isopach)
- Devonian Birdbear Formation (structure and
isopach)
- Devonian Duperow Formation (structure and
isopach)
- Devonian Duperow Formation, Flat Lake Salt (isopach
only)
- Devonian Souris River Formation (structure and
isopach)
- Devonian Souris River Formation, Upper Harris Salt (isopach only)
- Devonian Souris River Formation, Lower Harris Salt (isopach only)
- Devonian Souris River Formation, Davidson Salt (isopach
only)
- Devonian Dawson Bay Formation (structure and
isopach)
- Devonian Dawson Bay Formation, Hubbard Salt (isopach
only)
- Devonian Prairie Evaporite Formation (structure and
isopach)
- Devonian Winnipegosis Formation (structure and
isopach)
- Devonian Ashern Formation (structure and
isopach)
- Silurian Interlake Group (Formation) (structure and
isopach)
- Silurian Stonewall Formation (structure and
isopach)
- Silurian Stonewall Formation (Upper Stonewall Anhydrite) (isopach only)
- Ordovician Stonewall Formation (Basal Stonewall Anhydrite) (isopach only)
- Ordovician Stony Mountain Formation (structure and
isopach)
- Ordovician Red River Formation (structure and
isopach)
- Ordovician Red River Formation (Coronach Evaporite) (isopach only)
- Ordovician Red River Formation (Lake Alma Evaporite) (isopach only)
- Ordovician Winnipeg Formation (structure and
isopach)
- Cambrian Deadwood Formation (structure and
isopach)
- Precambrian Erosional Surface (structure only)
- Moving the mouse over the geological periods listed under
PERIOD will display a list of formations/groups in that
Period.
- Selecting a formation/group will display the corresponding
geology on the Map View on the left.
- Clicking on the Map View will allow you to choose the
corresponding isopach or structure map in a printable PDF (1100
kb) format.
PLEASE NOTE: The TGI stratigraphic column will only function properly with Internet Explorer 5.5 or
higher.
 |