
Revised Nitrogen Fertilizer Guidelines for Wheat, Barley and Canola in Manitoba
Prepared by John Heard, MB Ag Soil Fertility Specialist
In March 2009 the MB Soil Fertility Advisory Committee adopted the revised N rate guidelines for spring wheat, barley and canola presented at their annual meeting.
Following is a brief description of the data used in the revised N guidelines, the interpretation to development of the guidelines and the economic analysis.
1. Research studies used to develop N guidelines
The newer data set of studies had substantial change in production practices which are more typical than the crop/fallow systems used in the original data set (Table 1). Many of these production practices contributed to greater yield potential.
Table 1. Comparison of studies used in development of N rate guidelines
|
Studies used in 1990 recommendations |
Studies used in revised guidelines (1989-2004) |
Tillage |
Full tillage |
Most direct seeded |
Previous crop |
Fallow Cereal stubble |
No fallow Spring wheat, canola, barley, flax |
N application |
Spring broadcast |
Most spring banded N |
Cultivars |
Pre 1990 |
Most released post 1990 |
Pest management |
No fungicides |
Fungicides as required. |
The original N recommendations for cereals recognized that yield potential and N requirements varied across Manitoba based on available moisture supply and in 1982 the Manitoba Provincial Soil Testing Laboratory started offering N recommendations based on the moisture supply. Soils in the province were segregated in zones of recognized moisture supply as follows in Table 2. The newer N response studies were apportioned into similar categories.
Table 2. Available moisture supply by location and soil characteristics in Manitoba*.
Moisture supply |
Location |
Texture/drainage |
Moist |
|
Peat soils |
MB lowlands (E of the escarpment) and Swan River valley |
Any texture - poorly drained | |
Manitoba Uplands |
Heavy textured Dark-grey/grey wooded soils | |
Dry |
MB lowlands and Swan River valley |
Light textured, moderately drained |
Manitoba Uplands |
Light textured Dark-grey/grey wooded soils | |
Any texture - moderately to poorly drained | ||
Arid |
MB lowlands and Swan River valley |
Light textured - well drained |
Manitoba Uplands |
Light textured - well drained |
(* from 1Climate modified fertilizer recommendations for wheat, barley and oats. 1982. Manitoba Agronomists’ Proceedings. Pp137-144)
The contrast of maximum potential yields from the older and newer data set is displayed in Table 3. There was insufficient data to segregate the canola sites according to moisture categories, however most sites would be rated the Moist moisture supply category.
Table 3. Average yield potential from response curves according to moisture categories with older and newer data sets.
|
Wheat |
Barley | ||
Pre 1990 |
2008 |
Pre 1990 |
2008 | |
Yield Potential bu/ac | ||||
Moist |
48 |
65 |
76 |
124 |
Dry |
42 |
48 |
67 |
106 |
Arid |
33 |
34 |
52 |
59 |
2. Interpretation of data and development of N guidelines
The individual site data was plotted with yield versus total N (soil nitrate plus fertilizer N) and the average yield was characterized using the quadratic response function. The response equations are listed below.
In these equations (Y = a + bx + cx2 ),
Y = yield in bu/ac
X = lb soil + fertilizer N (note this is different than the former MB recommendations that considered N supply to be soil N + ½ fertilizer N)
a = the yield with no soil or applied N (presumably that yield produced by in-season mineralization)
b = the upward slope of the yield response
c = the rate at which the response diminishes, eventually flattens out and tips downward.
Wheat (Figure 1):
Moist environment (25 sites) |
Y = 24.75+ 0.4902x - 0.0015x2 |
R2 = 0.9927 |
| Dry environment (67 sites) | Y = 14.22 + 0.4159x - 0.0013x2 | R2 = 0.9436 |
| Arid environment (55 sites) | Y = 14.22+ 0.5464x - 0.0038x2 | R2 = 0.8175 |
Barley (Figure 2):
| *Moist environment (18sites) | Y = 34.75 + 1.152x - 0.0037x2 | R2 = 0.975 |
| Dry environment (70 sites) | Y = 31.73 + 1.5560x - 0.0082x2 | R2 = 0.984 |
| Arid environment (9 sites) | Y = 23.93+ 0.671x - 0.0032x2 | R2 = 0.899 |
* there was modification to the Moist barley data set to remove some studies with extremely high yields. It was felt that these yields exceeded those that may be achieved by Manitoba growers.
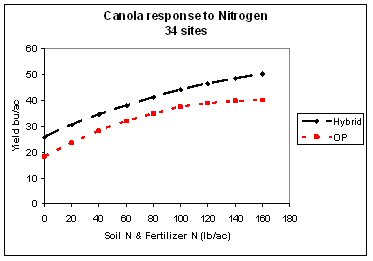
Canola (Figure 3):
| Hybrid canola (34 sites) | Y = 25.9 + 0.232x - 0.0005x2 | R2 = 0.998 |
| Open pollinated canola (34 sites) | Y = 18.3 + 0.280x - 0.0009x2 | R2 = 0.999 |
Figure 1. Wheat response to N.
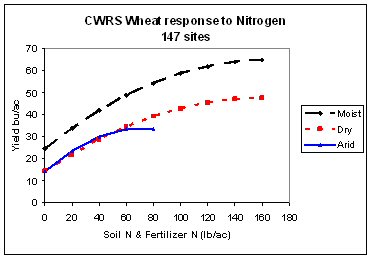
Figure 2. Barley response to N.
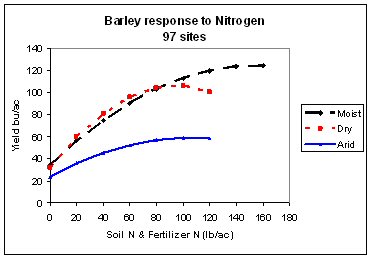
Figure 3. Canola response to N.
3. Fertilizer economic analysis
Recent wide fluctuation in crop prices and N costs prompted the presentation of the new N guidelines in a format that allows the user to contrast different crop price:N cost scenarios.
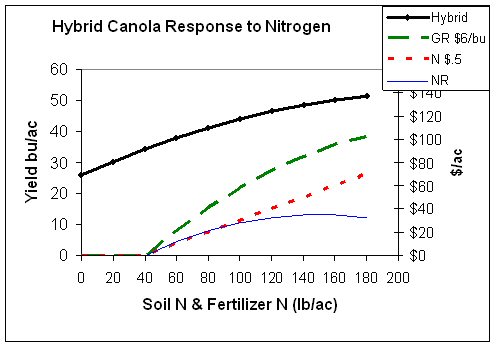
The following example with hybrid canola provides some background in how the calculator incorporates soil N crop price and fertilizer cost to develop the maximum economic rate of N (MERN).
The figure below represents the yield response of hybrid canola to applied and soil N. Assuming 40 lb residual N is in the soil, the gross return to applying N fertilizer when canola is $8/bu is shown by the green dotted line (GR $8/bu). The cost of that applied N is the red dashed line, representing the increasing N cost at 50 cent/lb N (line N $.5). The difference between these 2 lines is the blue line representing net return to applied N (NR). The point at which the net return line is greatest represents the maximum economical rate of N (MERN).
Figure 4. Economics of canola fertilization.
Changing crop prices and N costs will cause this Net Return line (NR) to change accordingly. Examples showing the change in net return to N are shown below where crop price increases (Figure 5) and where N cost increases (Figure 6).
Figure 5. Economics of canola fertilization – where canola increases in price from $6 to $10/bu with N cost constant at 50 cent/lb N.
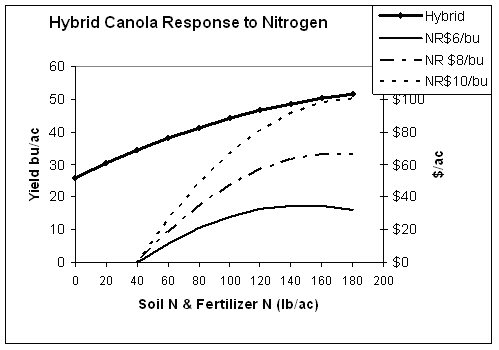
Figure 6. Economics of canola fertilization – where canola price remains at $8/bu with increasing N costs ($0.50, $0.75 and $1.00/lb N).
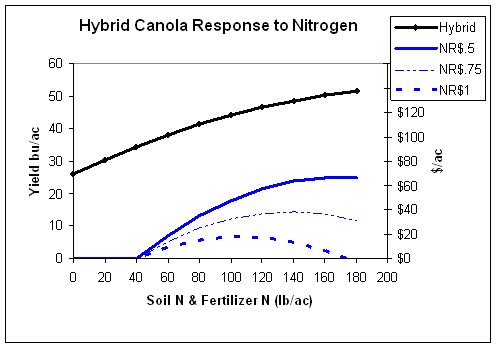
These figures illustrate the effects of changing costs and prices on the most economic rate of N. However, it is difficult to present numerous various options to growers in such chart format.
This Excel based N calculator, modified for Manitoba wheat, barley and canola crops by Karamanos, 20082, provides a spreadsheet method to interactively display different crop price and fertilizer cost options. It can be located here.
The grower does not set a yield goal, but chooses an appropriate moisture supply category. The maximum economical return to N is not based on yield goal, but is determined from the yield increase above where no N is applied. The total return is also supplied for reference and comparison purposes.
Growers may wish to exercise some risk management in these fertilizer rate decisions. Reasons why one might wish to exercise increasing levels of risk management:
1. High levels of production risk making it unlikely to achieve such yield increases illustrated in the calculator
- variable fields
- poor drainage, risk of severe drought
- risk of early frosts
- unable to provide optimum pest management
- delayed seeding
2. Economic risks
- high interest rates and high input carrying charges
- highly leveraged
In order to reduce the financial risk of fertilizing with high rates of N and not achieving these returns, you can demand a greater return on the last dollar spent on nitrogen. This is determined by the marginal revenue which equals the marginal return: marginal cost. Maximum economic N rate occurs when the last increment (or dollar) spent on N returns a dollar value of crop. To increase risk averseness you may choose to demand $1.25 or $1.50 return for that last $1 spent on nitrogen.
This is an option in the calculator by selecting the Marginal Return Chart.
References
2 Karamanos, R.E. 2008. Nitrogen and Phosphorus recommendations for Manitoba for today’s production costs. Presented at the 2008 Manitoba Agronomists Conference, Winnipeg, MB
http://umanitoba.ca/faculties/afs/MAC_proceedings/proceedings/2008/Regis%20Karamanos%20paper.pdf
1Soil Science Lead Committee, Chair R.A. Hedlin. 1982. Climate modified fertilizer recommendations for wheat, barley and oats. 1982 Manitoba Agronomists’ Proceedings. Pp137-144