Provincial Respiratory Surveillance Report
COVID-19 and Seasonal Influenza
2022-2023
This weekly report provides a current epidemiological update on the intensity and severity of respiratory activity in Manitoba including laboratory confirmed activity of both COVID-19 and seasonal influenza. Surveillance data include syndromic indicators, laboratory testing, associated hospitalization and mortality, and outbreaks. Updates around immunization coverage in COVID-19 and seasonal influenza are also included.
Data are reported with a one-week delay for increased data accuracy, completeness and reliability. More analyses continue to be conducted and will be added to this report as available. It is published online at approximately 10:00am every Friday.
Week 48 (November 27 – December 3)
Due to an influx of influenza laboratory reports this respiratory season, Manitoba Health is experiencing delays in the documentation of laboratory results within the provincial Public Health Information Management System (PHIMS). As s result, the influenza case counts for week 48 are lower than expected. We anticipate an update to these data in next week's report.
Data extracted up to 1:00 am on December 8, 2022
Next reporting date: December 16, 2022
COVID-19 vaccination / Seasonal Influenza vaccination
|
|
|||||||||||||
|
|
|||||||||||||
|
||||||||||||||
|
|
|
||||||||||||
|
||||||||||||||
|
|
|
||||||||||||
|
Important Notes
|
||||||||||||||
COVID-19
Cases
Figure 1. Weekly Cases of COVID-19 by Season, Manitoba, 2020 – 2022 (July through June)
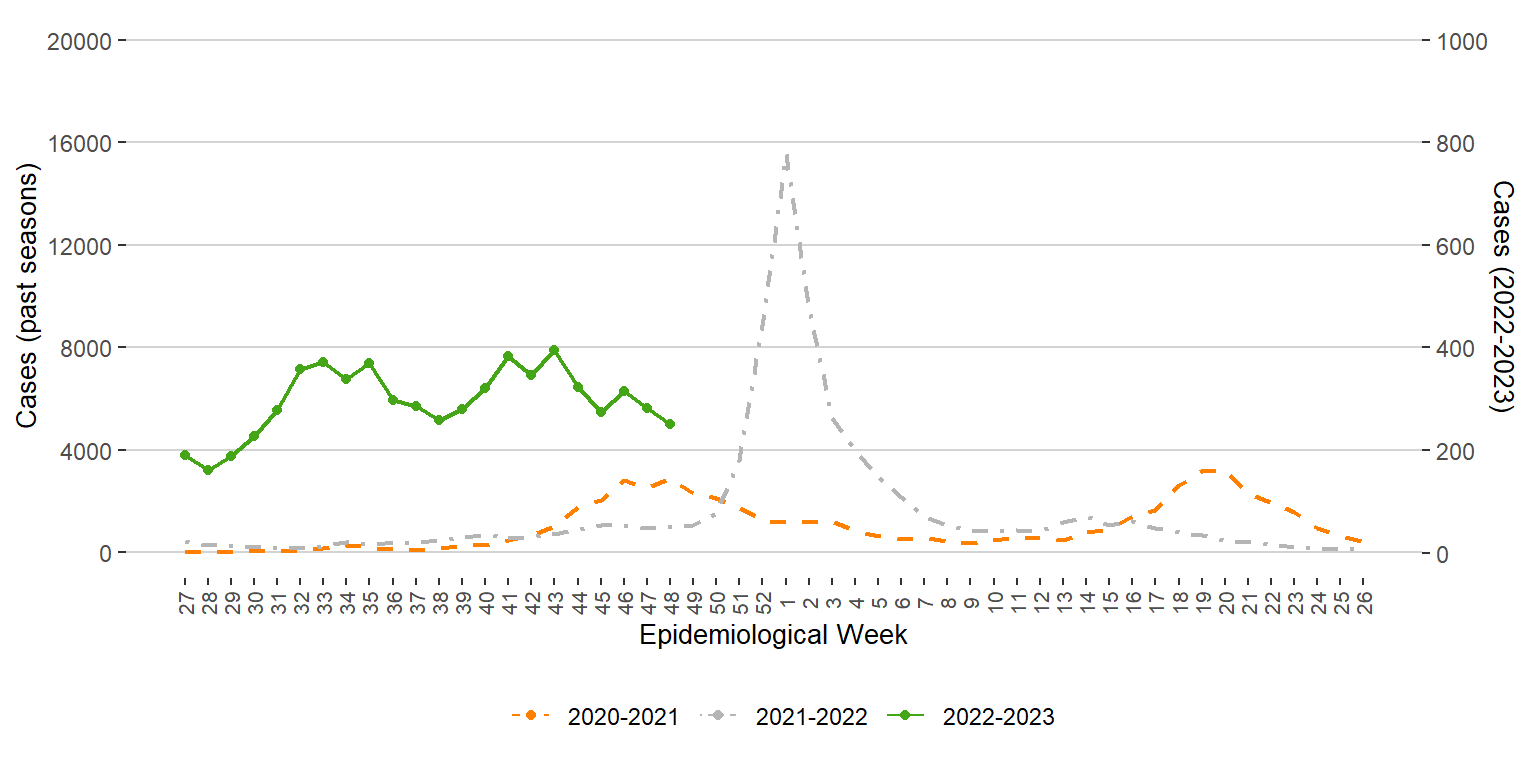
Figure 2. Sex and Age Distribution of COVID-19 Cases, Manitoba, July 3, 2022 – December 3, 2022
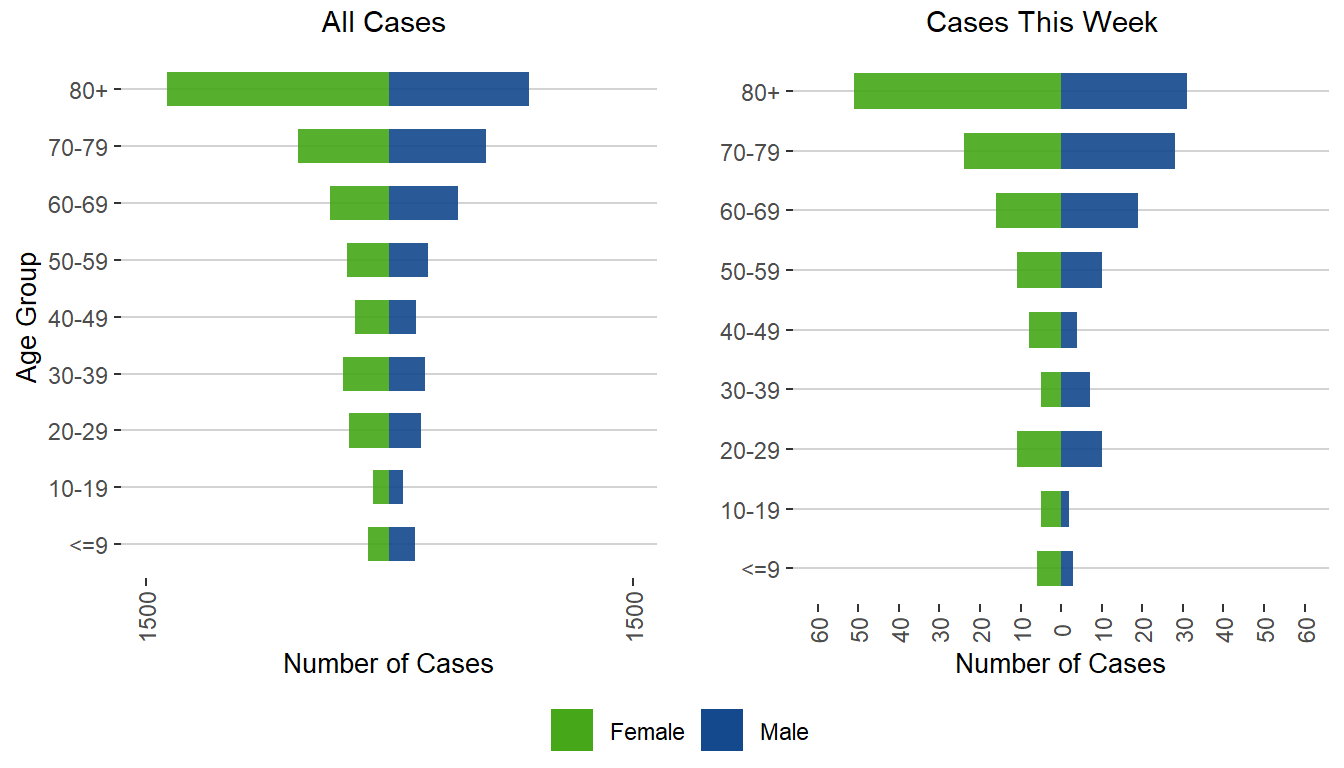
Figure 3. Incidence Rate (/10,000 Population) of COVID-19 Cases by Age Group and Week of Public Health Report Date, Manitoba, July 3, 2022 – December 3, 2022
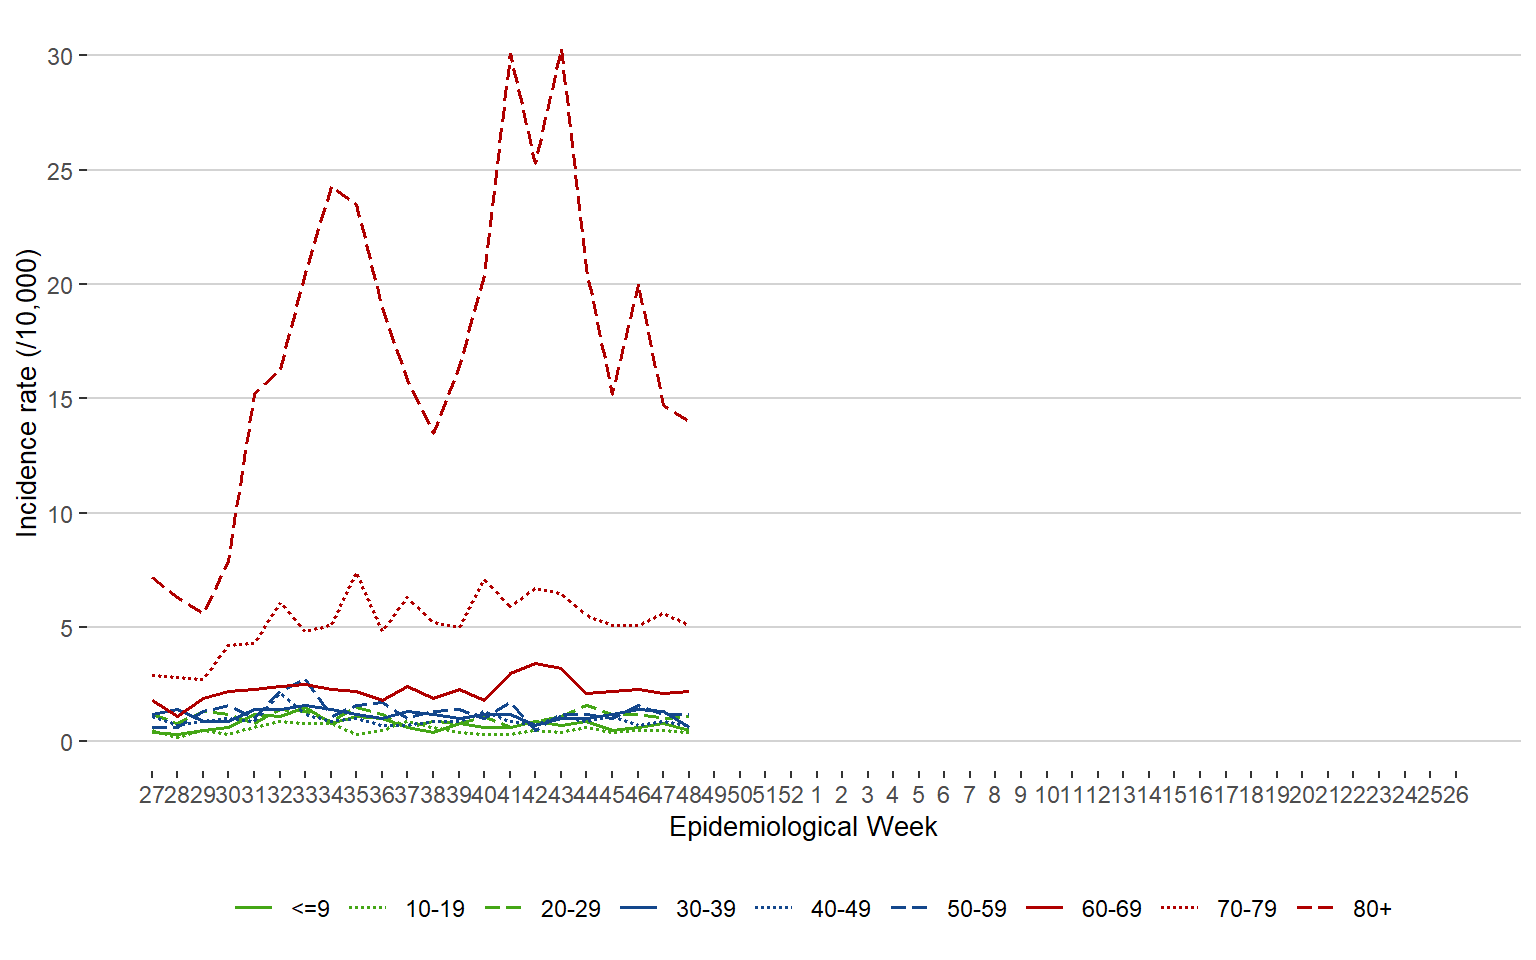
Figure 4. Cases of COVID-19 by Health Region and Public Health Report Date, Manitoba, August 1, 2022 – December 3, 2022
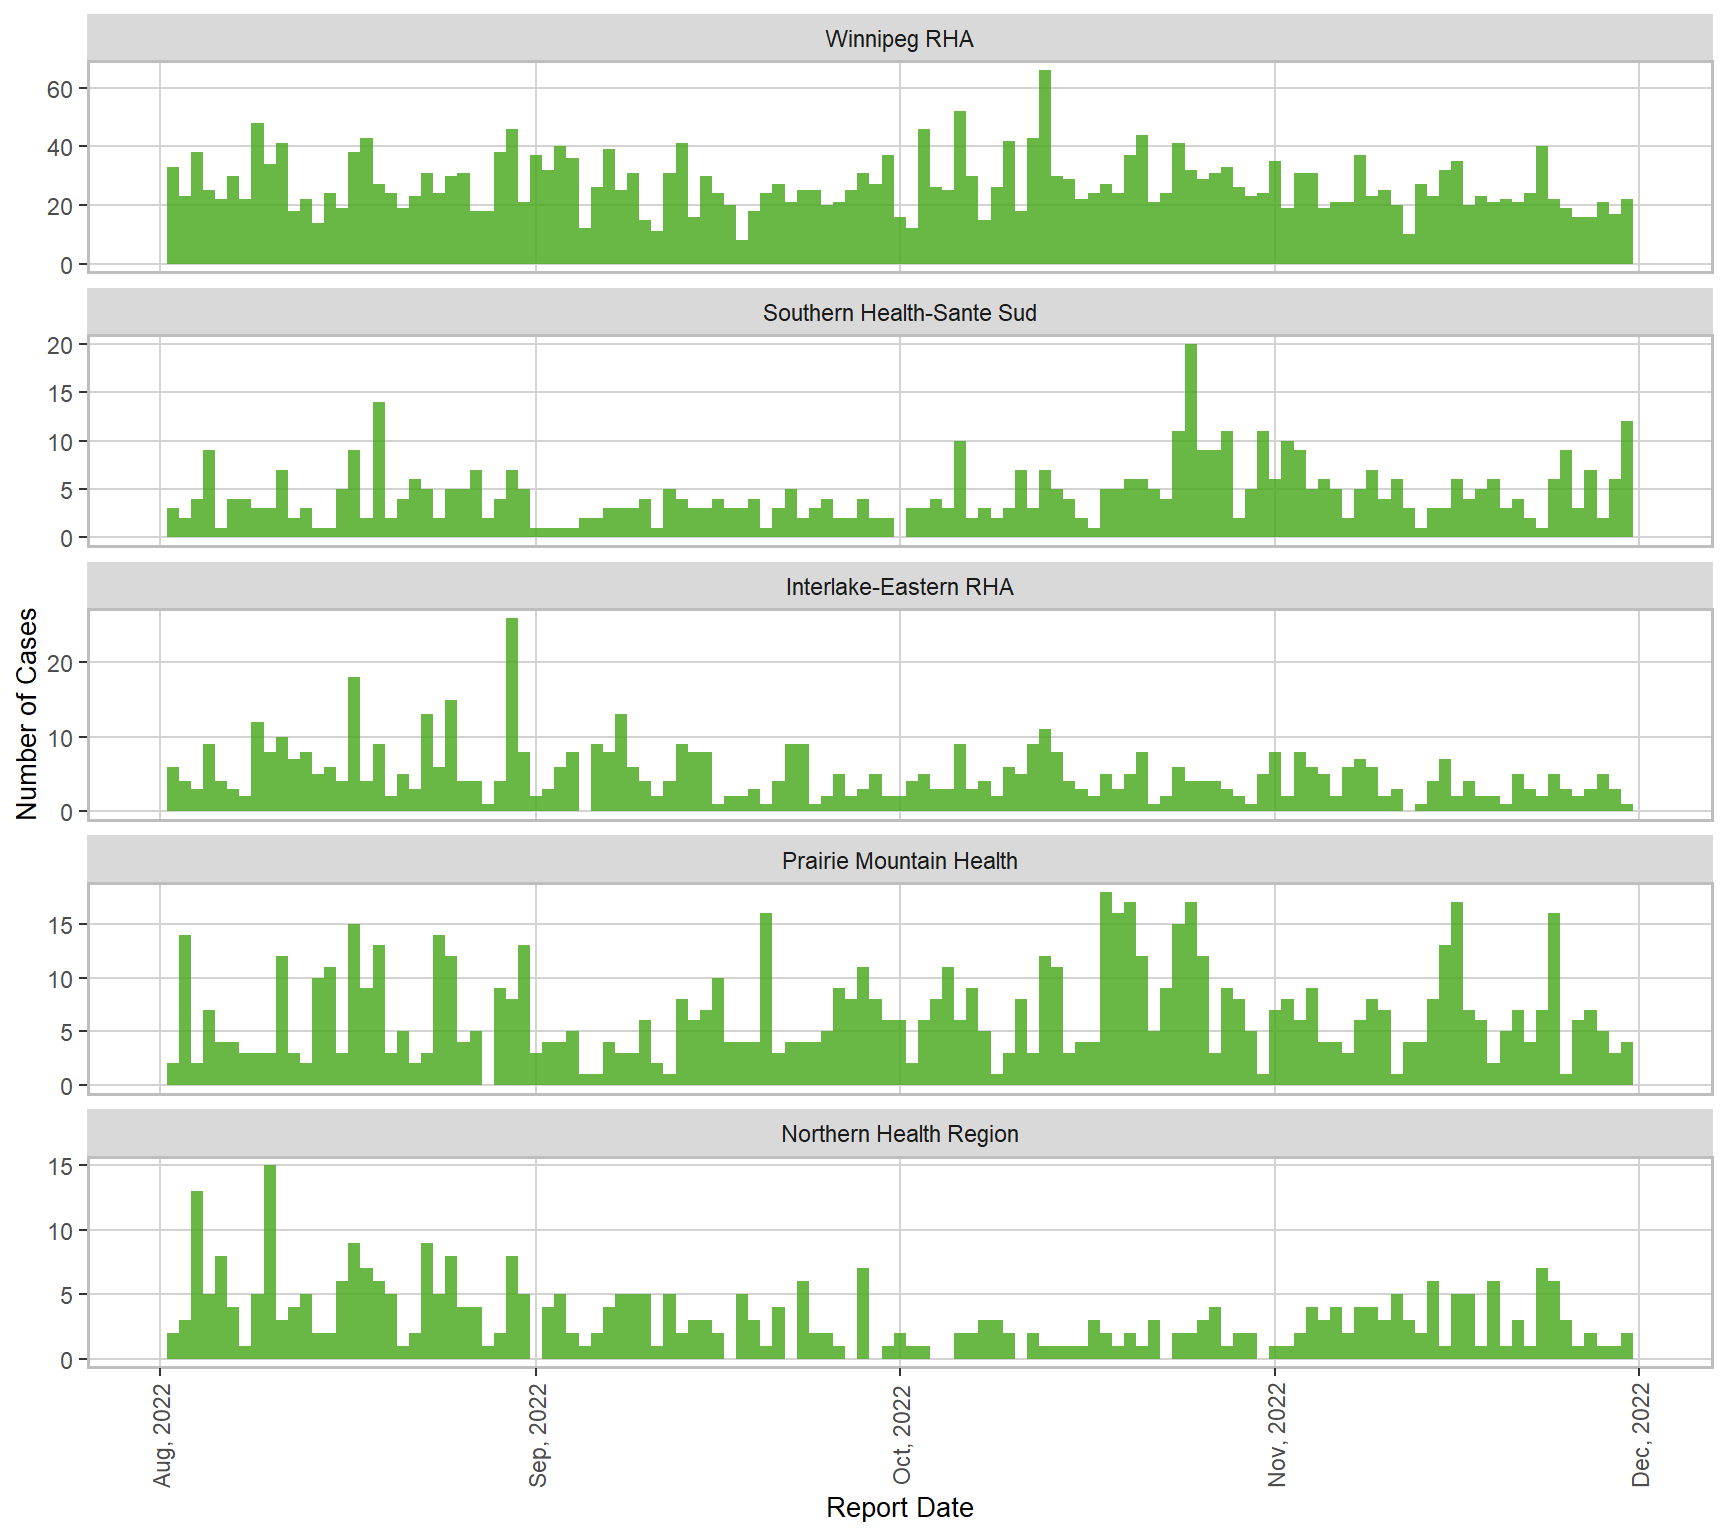
Table 1. Cases of COVID-19 and Incidence Rate (/10,000 population) by Health Region, Manitoba, July 3, 2022 – December 3, 2022
| Helath region | Total cases | Cases this week | Incidence rate this week | Age-standardized incidence rate* this week |
|---|---|---|---|---|
| Winnipeg RHA | 3845 | 135 | 1.7 | 1.7 |
| Southern Health-Santé Sud | 621 | 48 | 2.2 | 2.5 |
| Interlake-Eastern RHA | 694 | 22 | 1.6 | 1.5 |
| Prairie Mountain Health | 871 | 30 | 1.7 | 1.5 |
| Northern Health Region | 447 | 16 | 2.1 | 2.9 |
Note: * Age-standardized rates are used to account for differences in the age structure in health regions. The whole Manitoba population is used as the standard population.
Testing
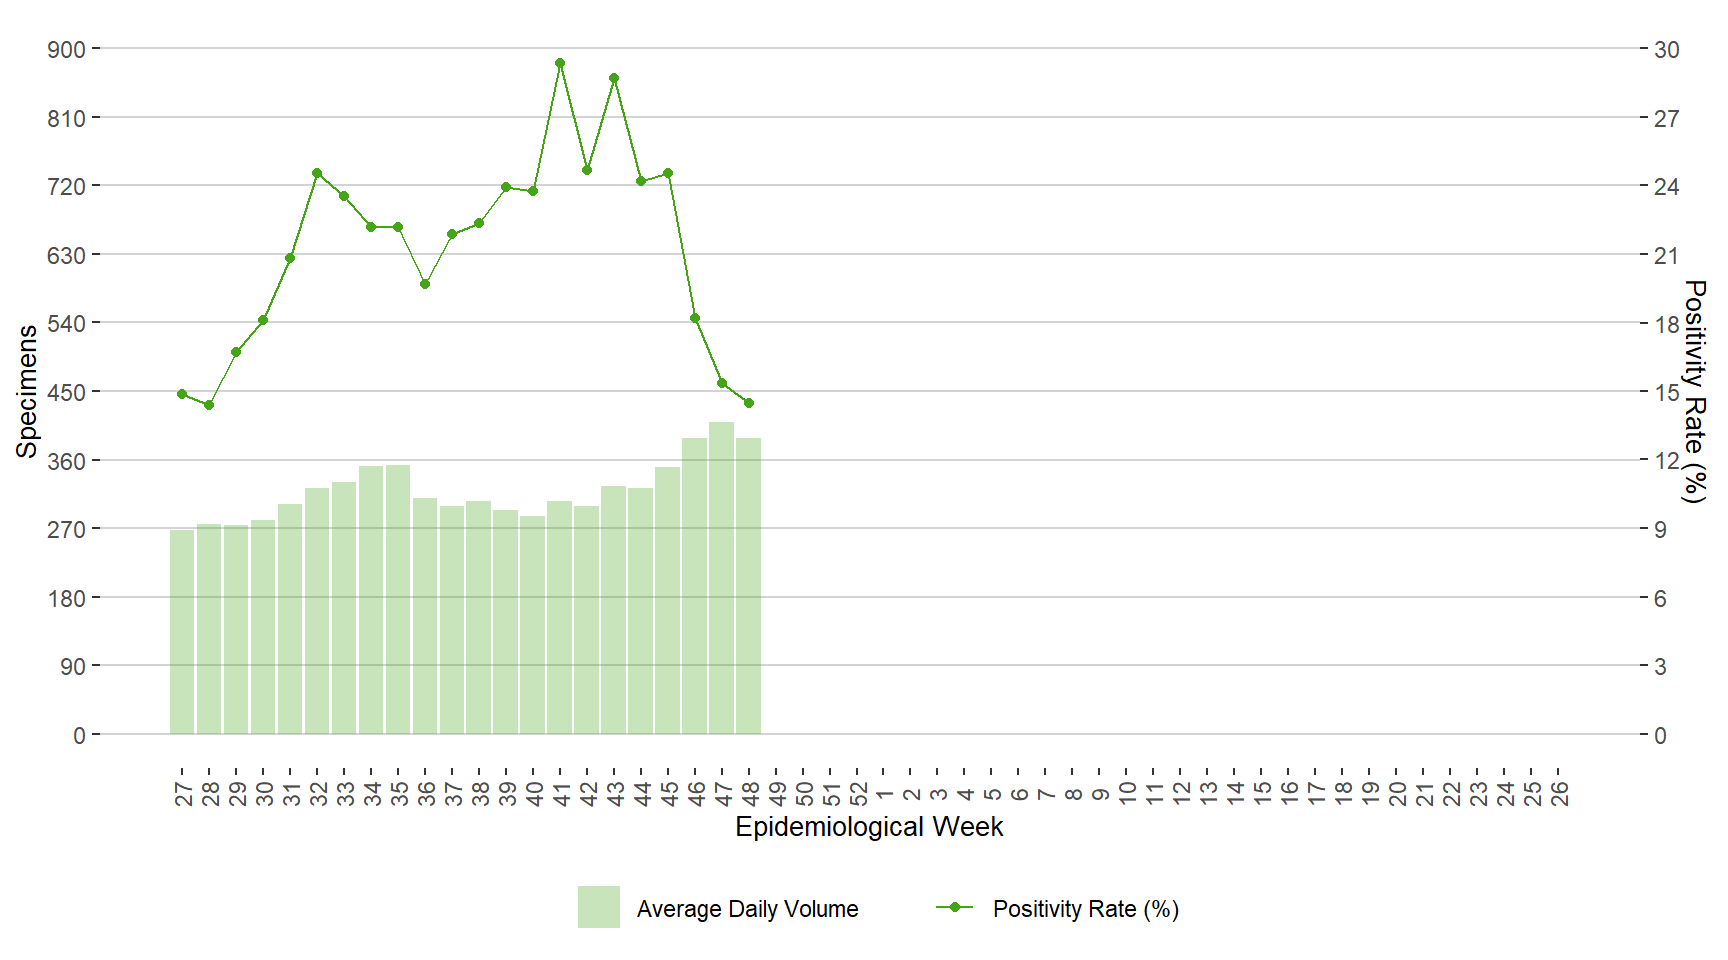
Figure 5. Average Daily Testing Volume and Positivity (%) for COVID-19 by Week of Specimen Receiving Date, Manitoba, July 3, 2022 – December 3, 2022
Severity
Figure 6. Severe Outcomes of COVID-19 by Week of Outcome Date, Manitoba, July 3, 2022 – December 3, 2022
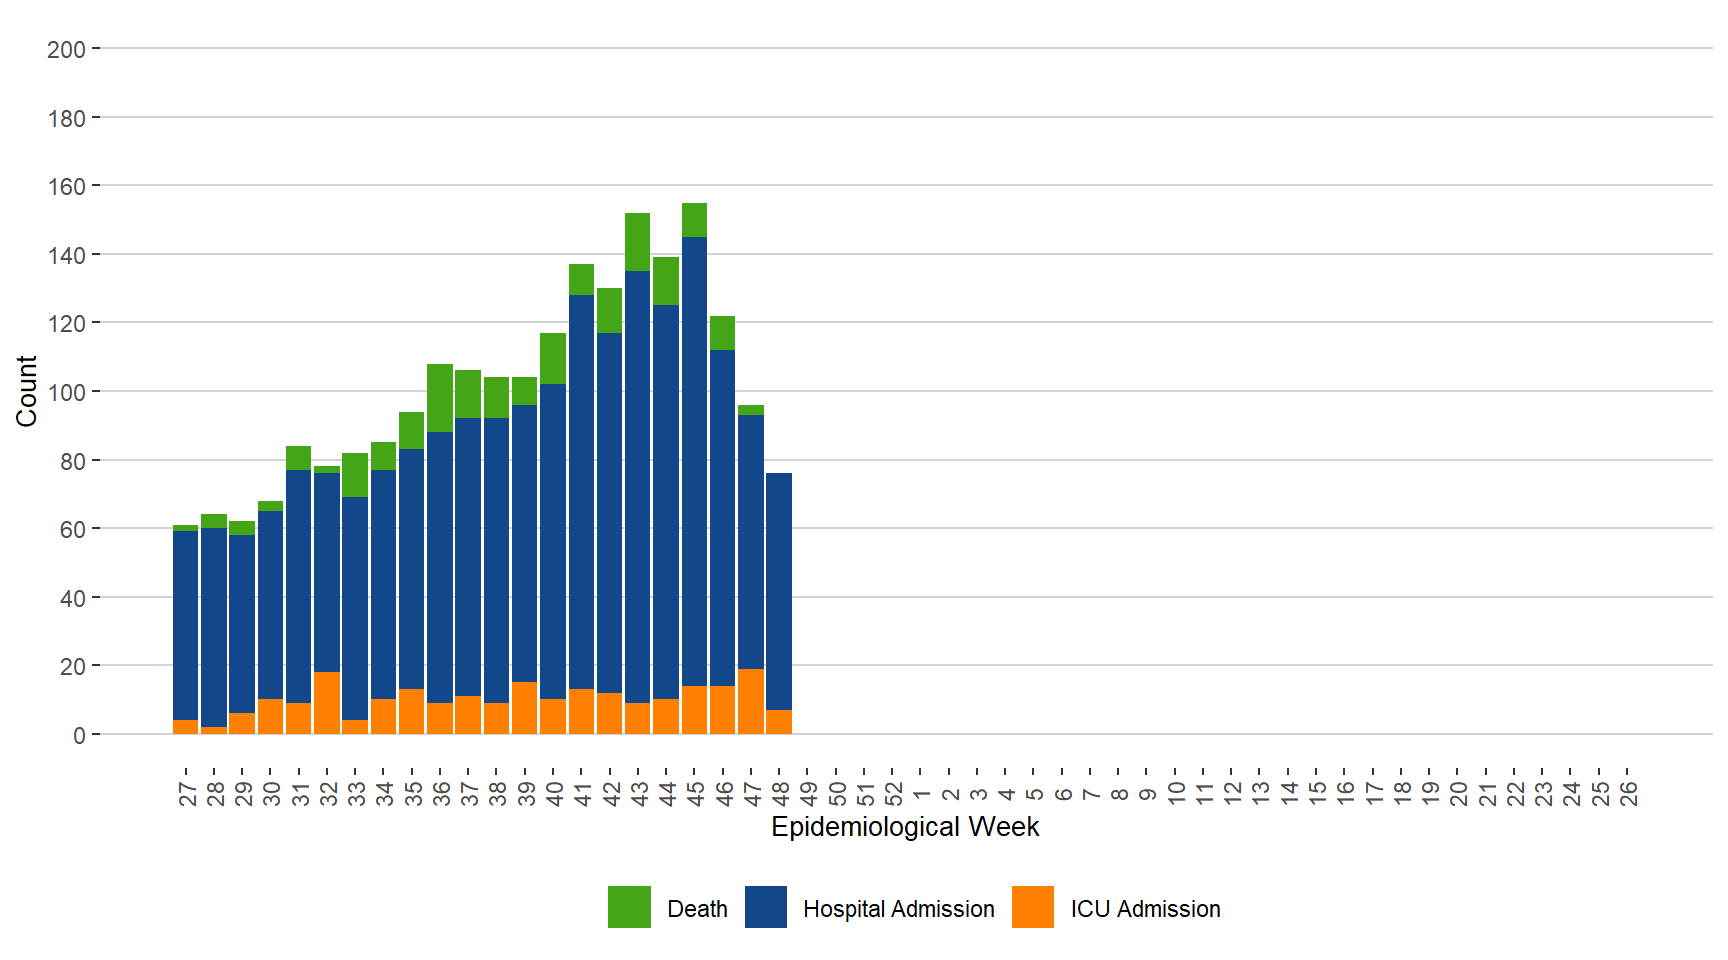
Note. ICU admissions are not included in the hospital admissions.
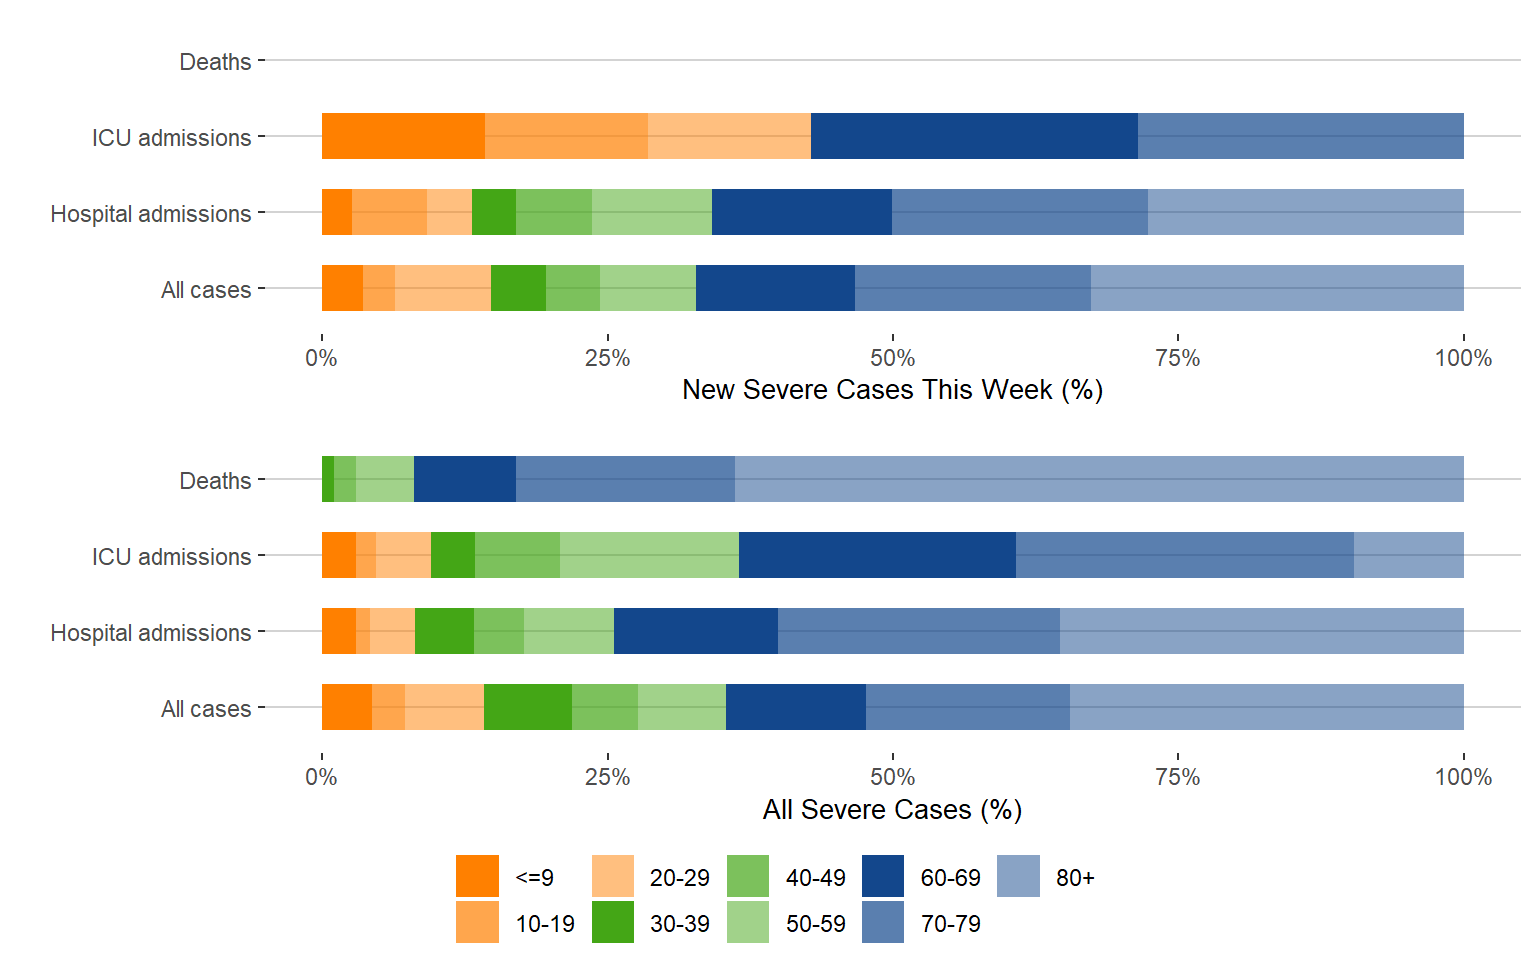
Figure 7. Age Distribution of Severe COVID-19 Cases This Week Compared to All Cases, Manitoba, July 3, 2022 – December 3, 2022
Outbreaks
Figure 8. Weekly COVID-19 Outbreaks, Manitoba, 2020 – 2022
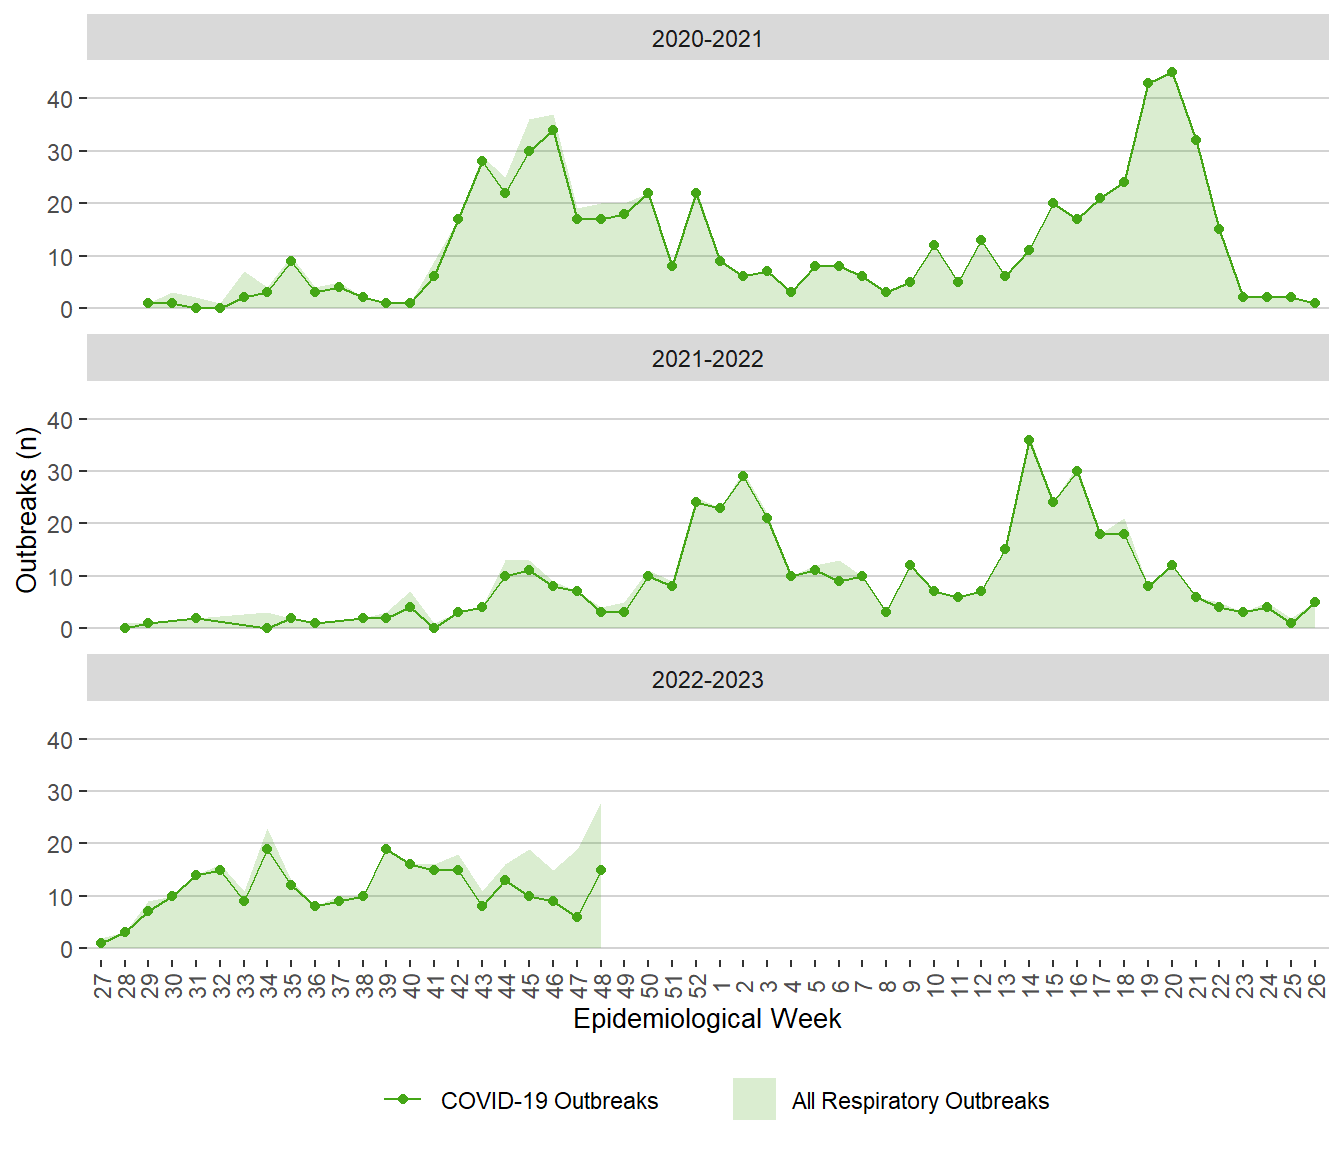
Note: All respiratory outbreaks include COVID-19 outbreaks, influenza outbreaks and the other respiratory outbreaks with known or unknown pathogens.
Vaccination
Table 2. Coverage of COVID-19 Vaccinations, Manitoba, December 3, 2022
| Age group (years) | At least 1 dose | At least 2 doses | At least 1 dose within the last 6 months | At least 1 dose of Bivalent |
|---|---|---|---|---|
| .5-04 | 9.0% | 3.3% | 8.9% | 0.0% |
| 05-11 | 55.9% | 42.7% | 9.1% | 0.1% |
| 12-17 | 82.8% | 78.2% | 8.9% | 4.5% |
| 18-29 | 88.5% | 85.4% | 7.0% | 5.7% |
| 30-39 | 84.5% | 82.0% | 11.5% | 10.1% |
| 40-49 | 87.8% | 86.0% | 15.6% | 13.8% |
| 50-59 | 87.1% | 85.8% | 23.6% | 17.1% |
| 60-69 | 94.7% | 93.5% | 40.8% | 30.6% |
| 70-79 | >=95.0% | >=95.0% | 53.5% | 42.1% |
| 80+ | >=95.0% | >=95.0% | 53.4% | 44.0% |
| ALL | 81.3% | 78.0% | 20.3% | 14.9% |
For more information, please visit COVID-19 vaccination coverage in Canada - Canada.ca
Seasonal Influenza
Cases
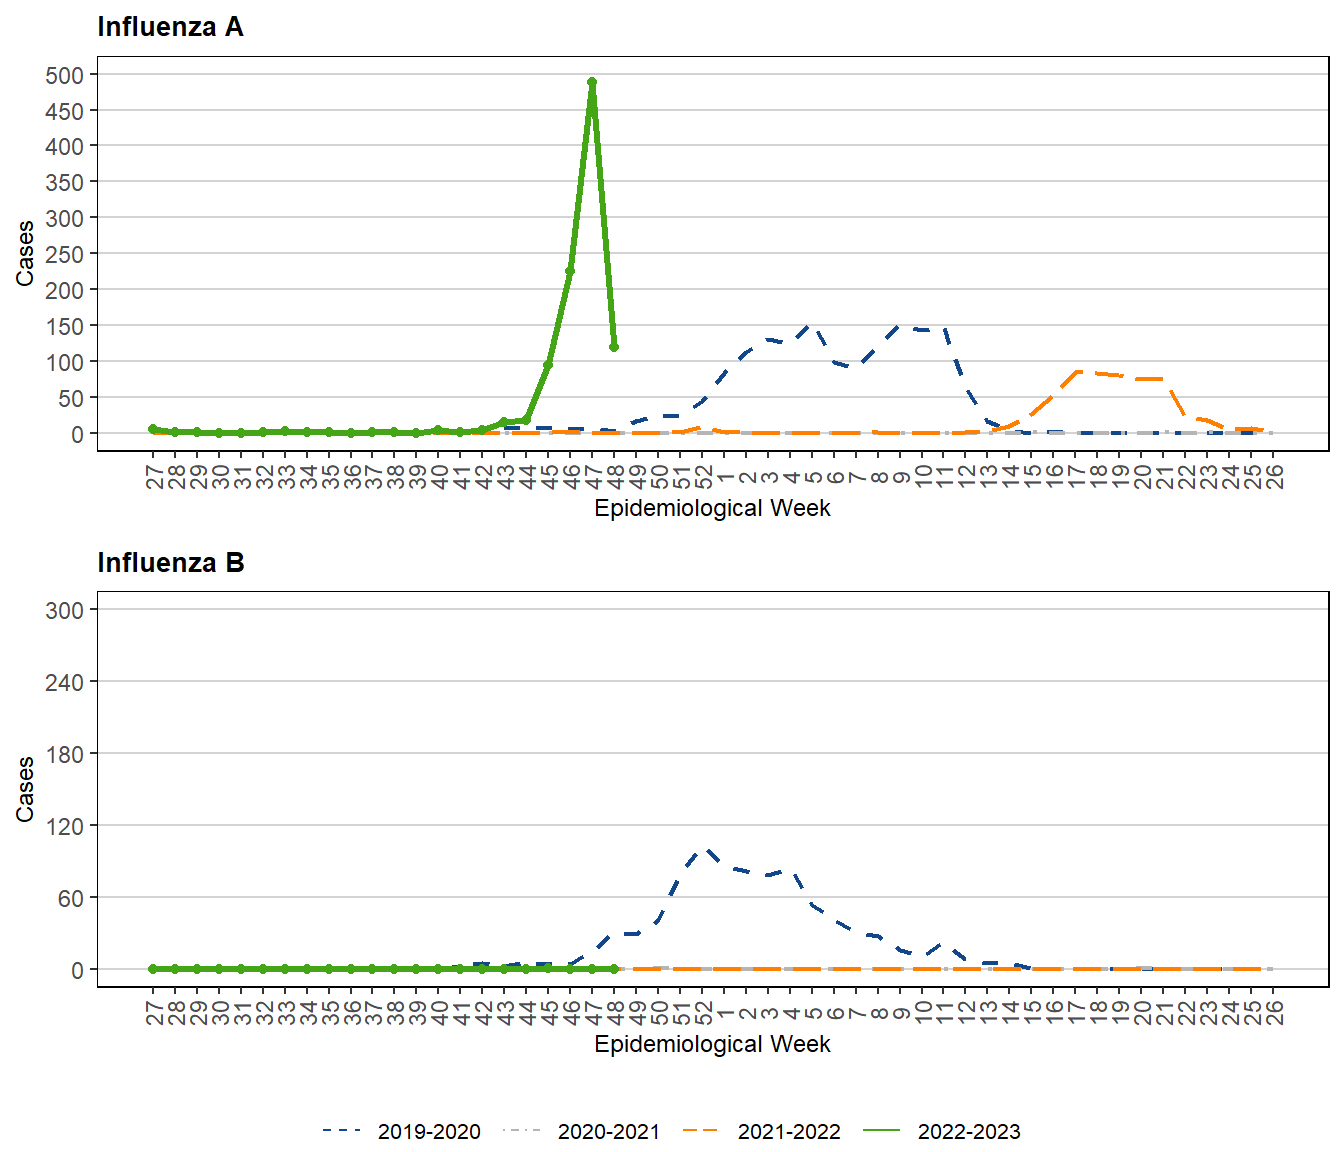
Figure 9. Weekly Cases of Influenza by Season, Manitoba, 2019 – 2022 (July through June)
 Back
Back
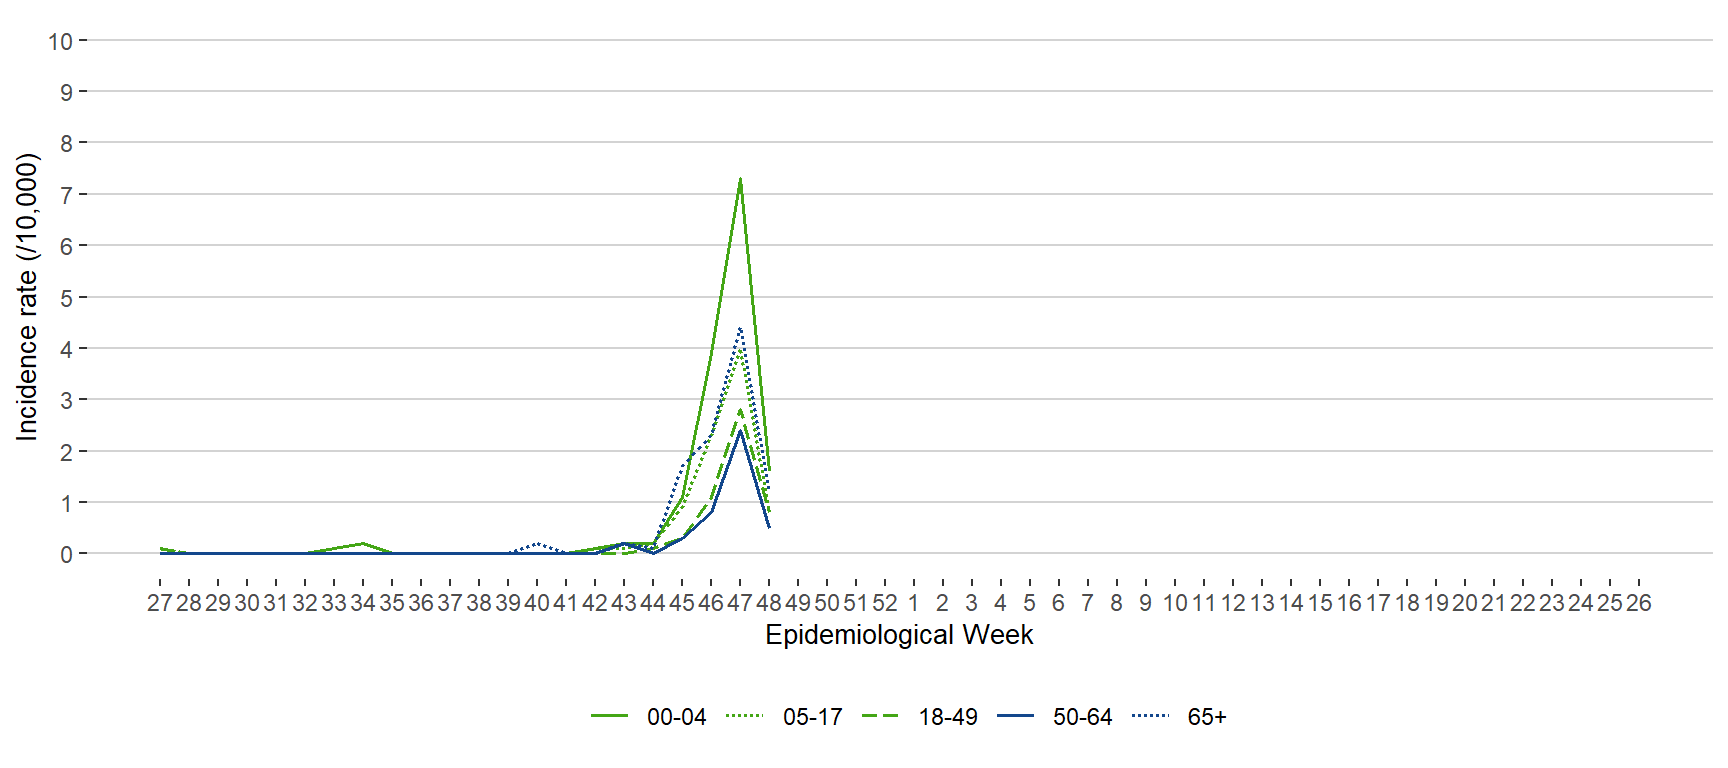
Figure 10. Incidence Rate (/10,000 Population) of Influenza Cases by Age Group and Week of Public Health Report Date, 2018 – December 3, 2022
 Back
Back
Table 3. Cases of Influenza and Incidence Rate (/10,000 population) by Health Region, Manitoba, July 3, 2022 – December 3, 2022
| Helath region | Total cases | Cases this week | Incidence rate this week | Age-standardized incidence rate* this week |
|---|---|---|---|---|
| Winnipeg RHA | 511 | 58 | 0.7 | 0.7 |
| Southern Health-Santé Sud | 127 | 17 | 0.8 | 0.8 |
| Interlake-Eastern RHA | 153 | 25 | 1.8 | 2.1 |
| Prairie Mountain Health | 154 | 14 | 0.8 | 0.8 |
| Northern Health Region | 36 | <5 | 0.5 | 0.6 |
Note: * Age-standardized rates are used to account for differences in the age structure in health regions. The whole Manitoba population is used as the standard population.
BackTesting
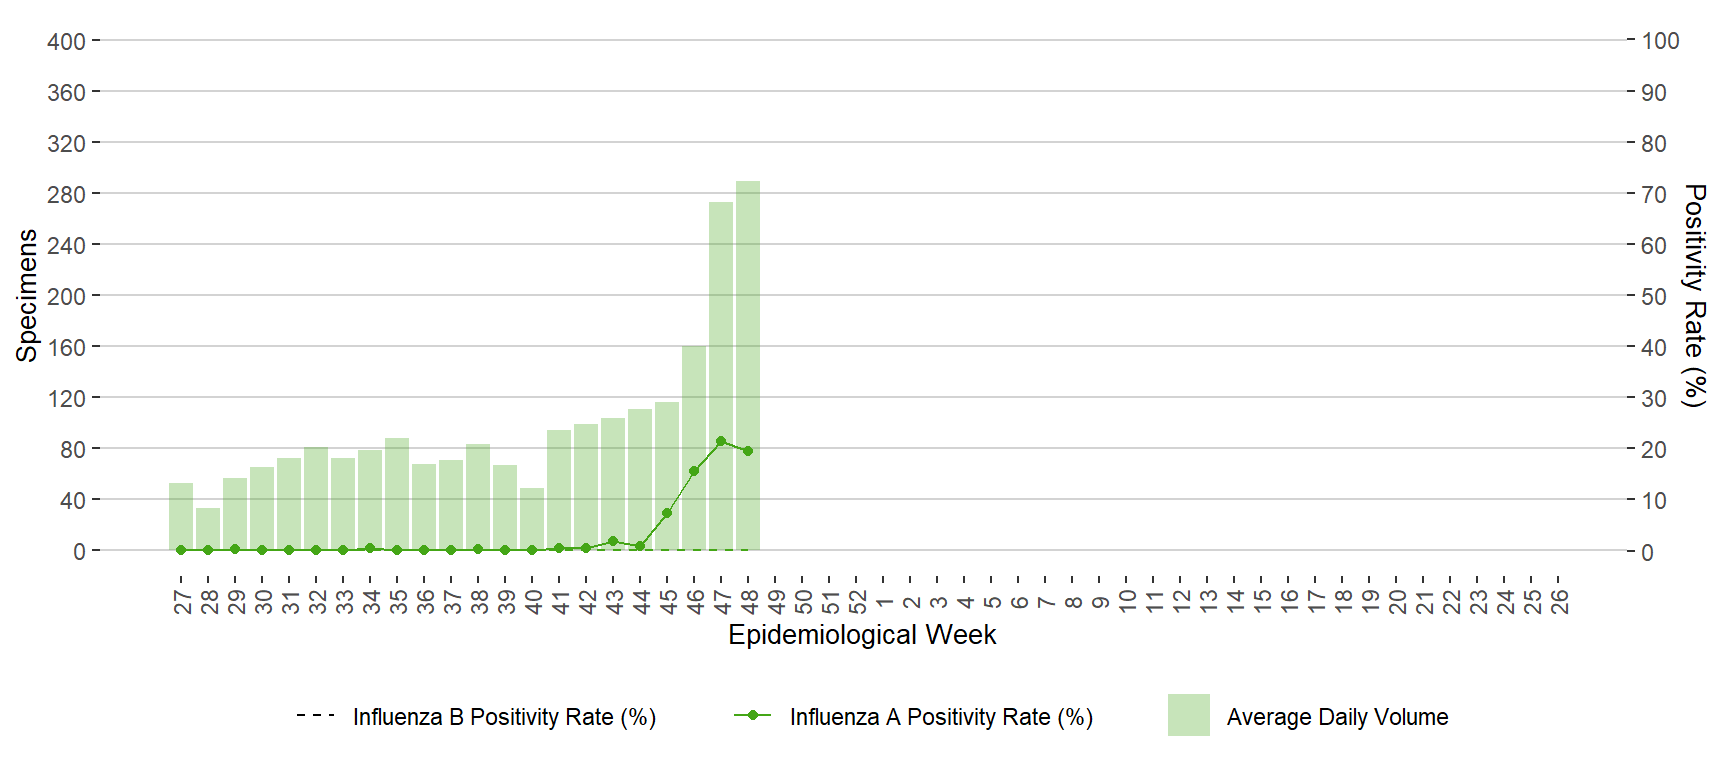
Figure 11. Average Daily Testing Volume and Positivity (%) for Influenza by Week of Specimen Receiving Date, Manitoba, July 3, 2022 – December 3, 2022
 Back
Back
Figure 12. Number of Positive Respiratory Virus Tests by Week of Specimen Receiving Date, Manitoba, July 3, 2022 – December 3, 2022
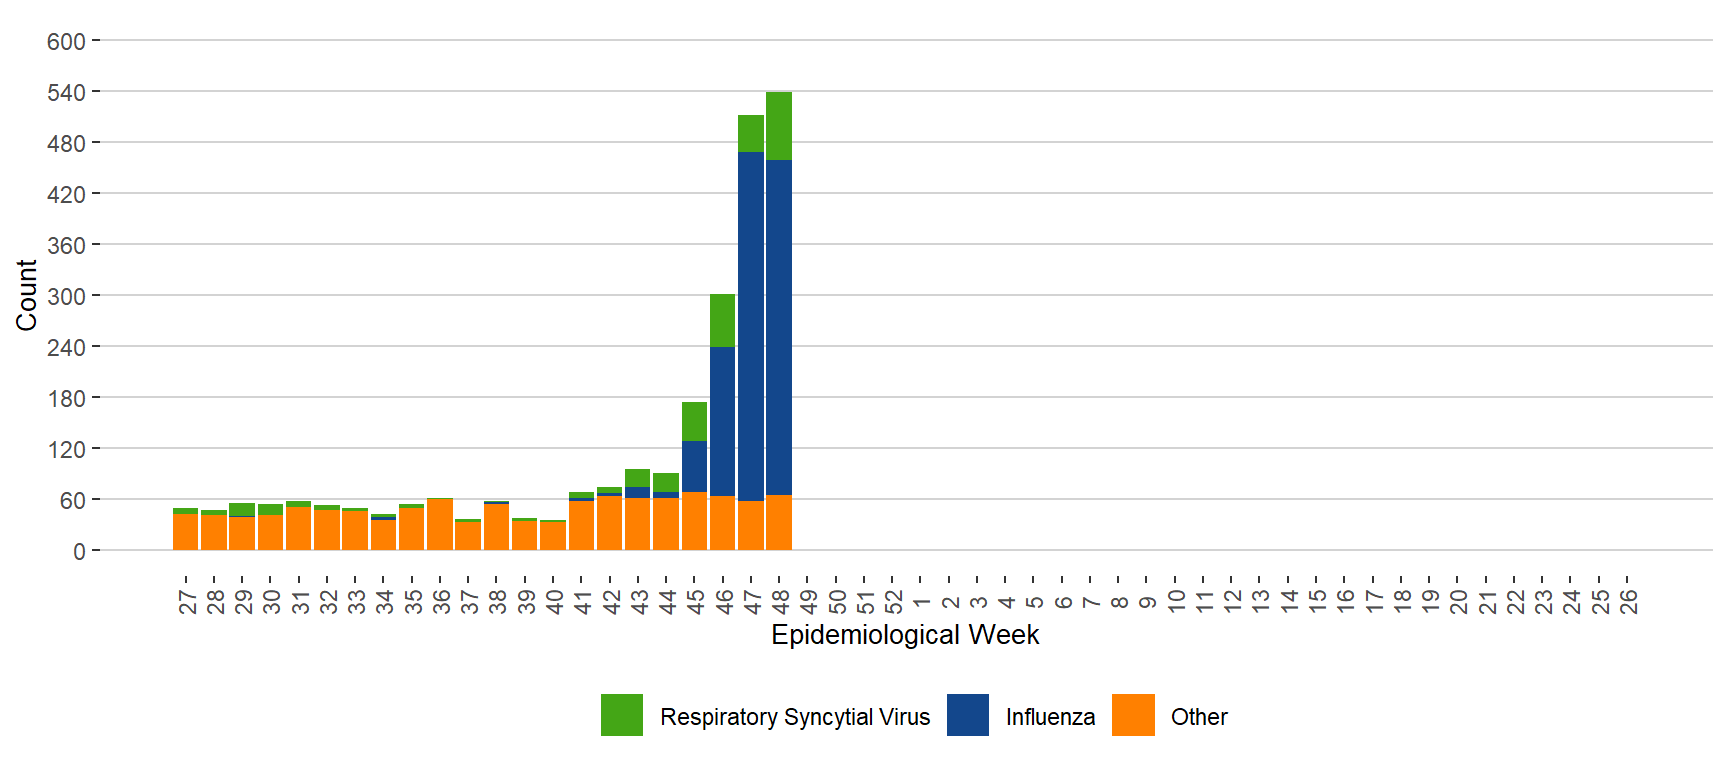
Note. Other respiratory viruses include adenovirus, enterovirus/rhinovirus, human coronavirus (seasonal), human metapneumovirus and human parainfluenza virus.
BackSeverity
Figure 13. Severe Outcomes of Influenza by Week of Outcome Date, Manitoba, July 3, 2022 – December 3, 2022
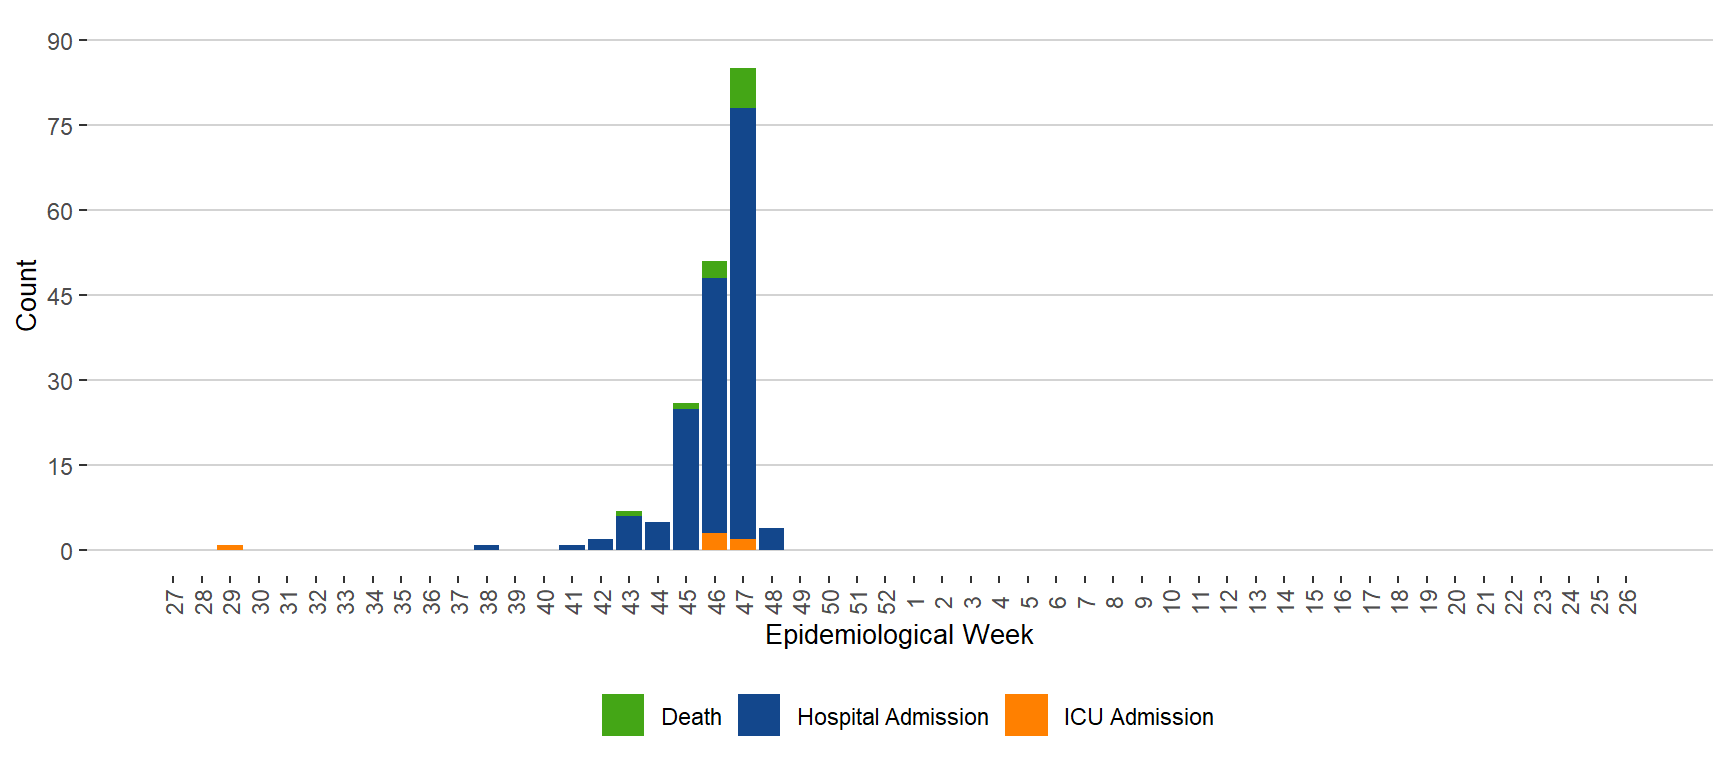
Note. ICU admissions are not included in the hospital admissions.
BackFigure 14. Age Distribution of Severe Influenza Cases in All Cases, Manitoba, July 3, 2022 – December 3, 2022
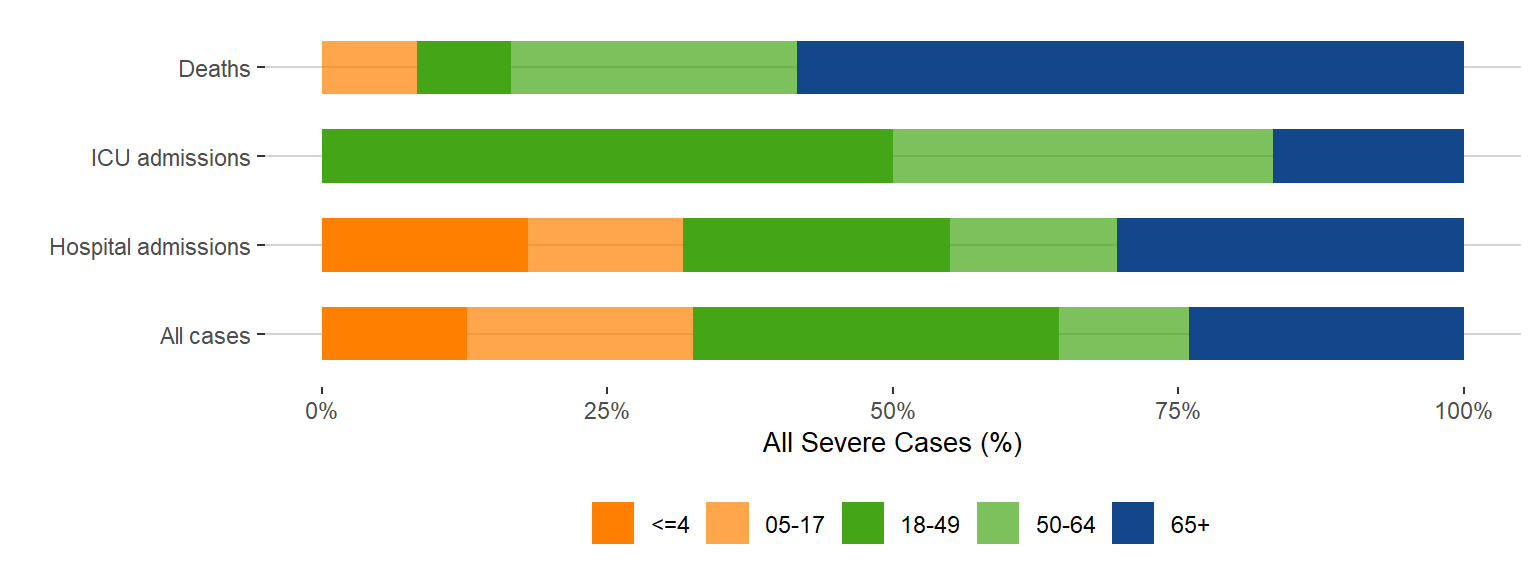 Back
Back
Outbreaks
Figure 15. Weekly Respiratory and Influenza Outbreaks, Manitoba, 2019 – December 3, 2022
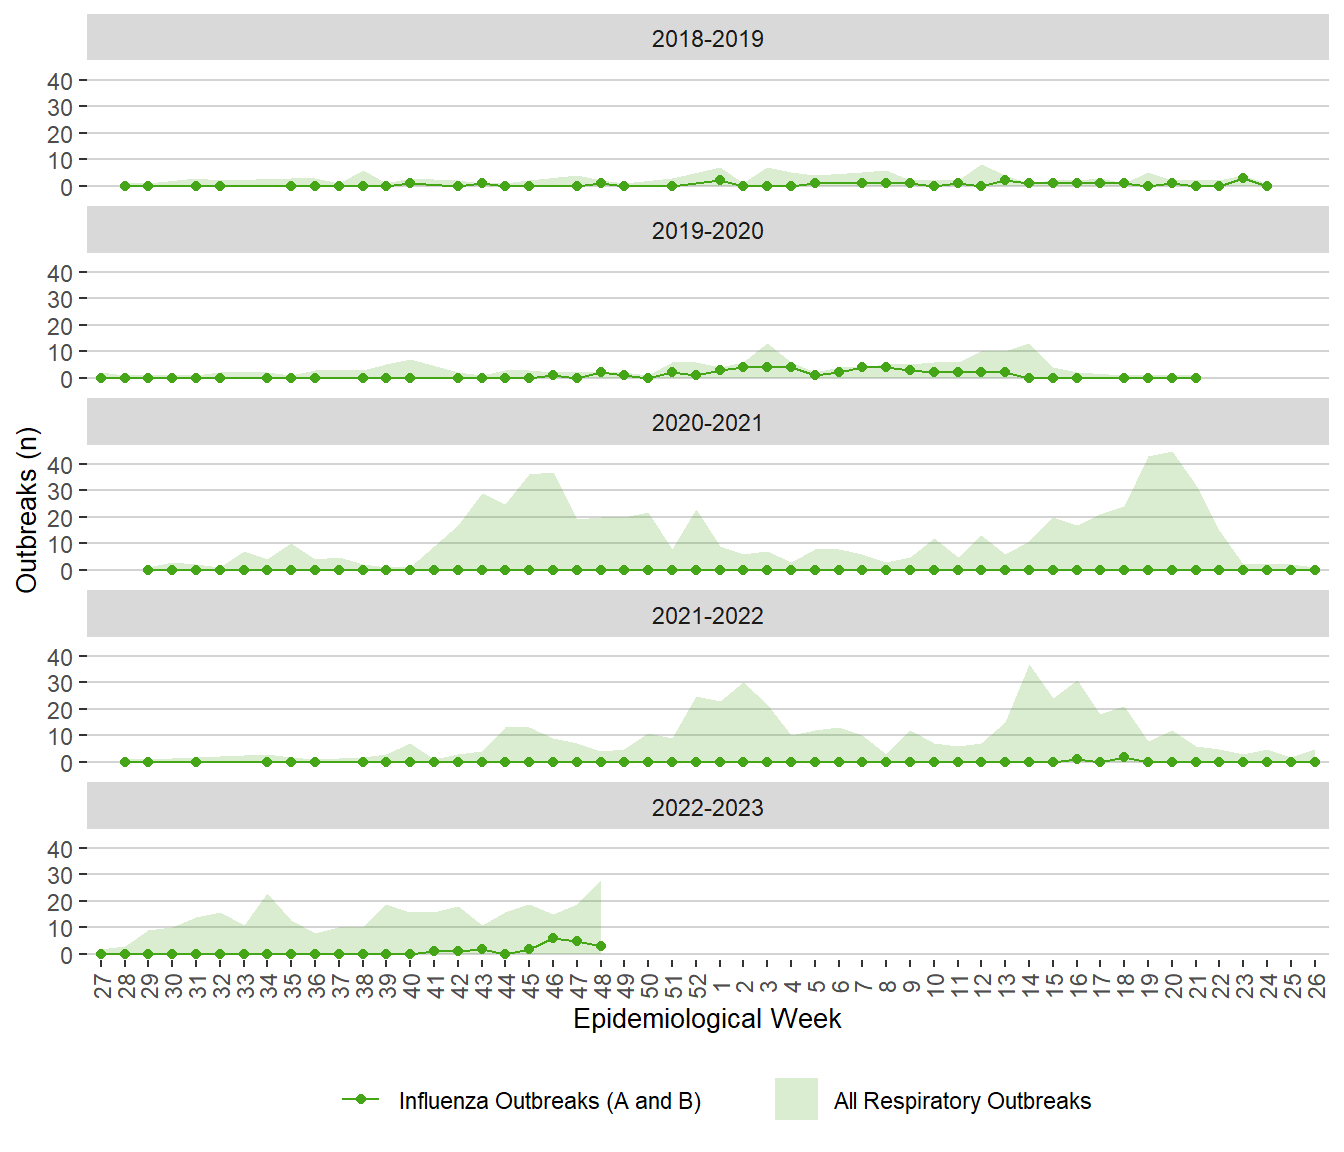
Note: All respiratory outbreaks include COVID-19 outbreaks, influenza outbreaks and the other respiratory outbreaks with known or unknown pathogens.
Vaccinations
Table 5. Coverage of Influenza Vaccinations, Manitoba, September 1, 2022 – December 3, 2022
| Age group | Does | Coverage percentage |
|---|---|---|
| 0-4 | 10385 | 12.2% |
| 5-17 | 26339 | 11.6% |
| 18-49 | 73941 | 12.5% |
| 50-64 | 68324 | 26.4% |
| 65+ | 129687 | 55.4% |
| All | 310750 | 22.2% |
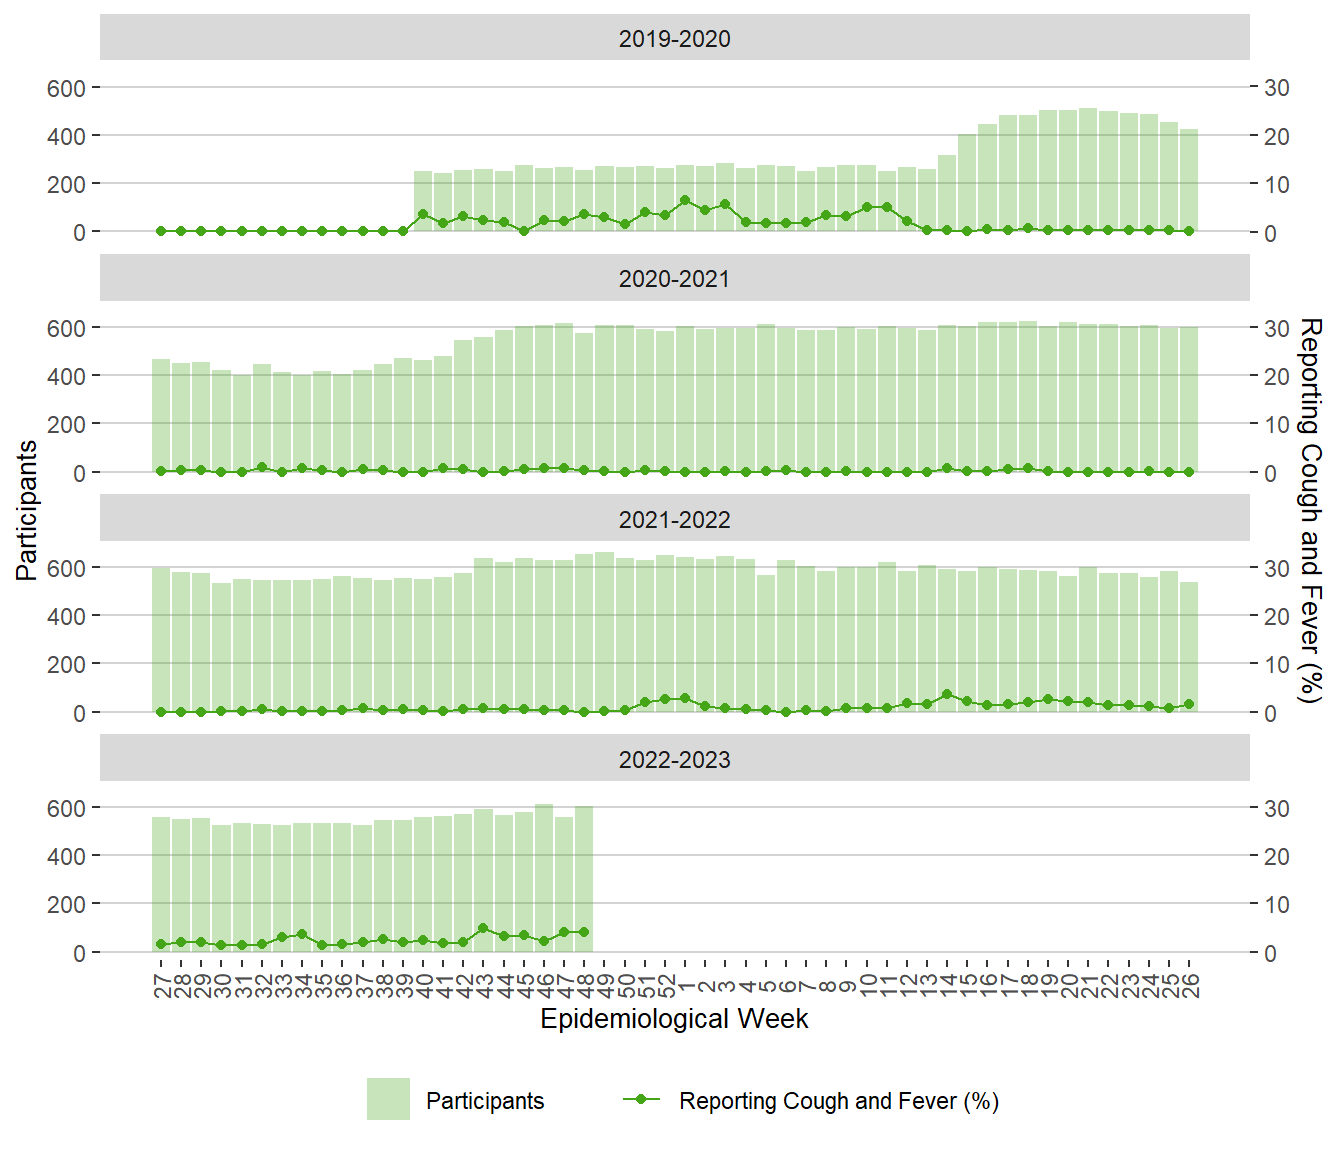
FluWatchers
Figure 16. Weekly FluWatchers Participants and Percentage Reporting Fever and Cough, Manitoba, 2019 – December 3, 2022
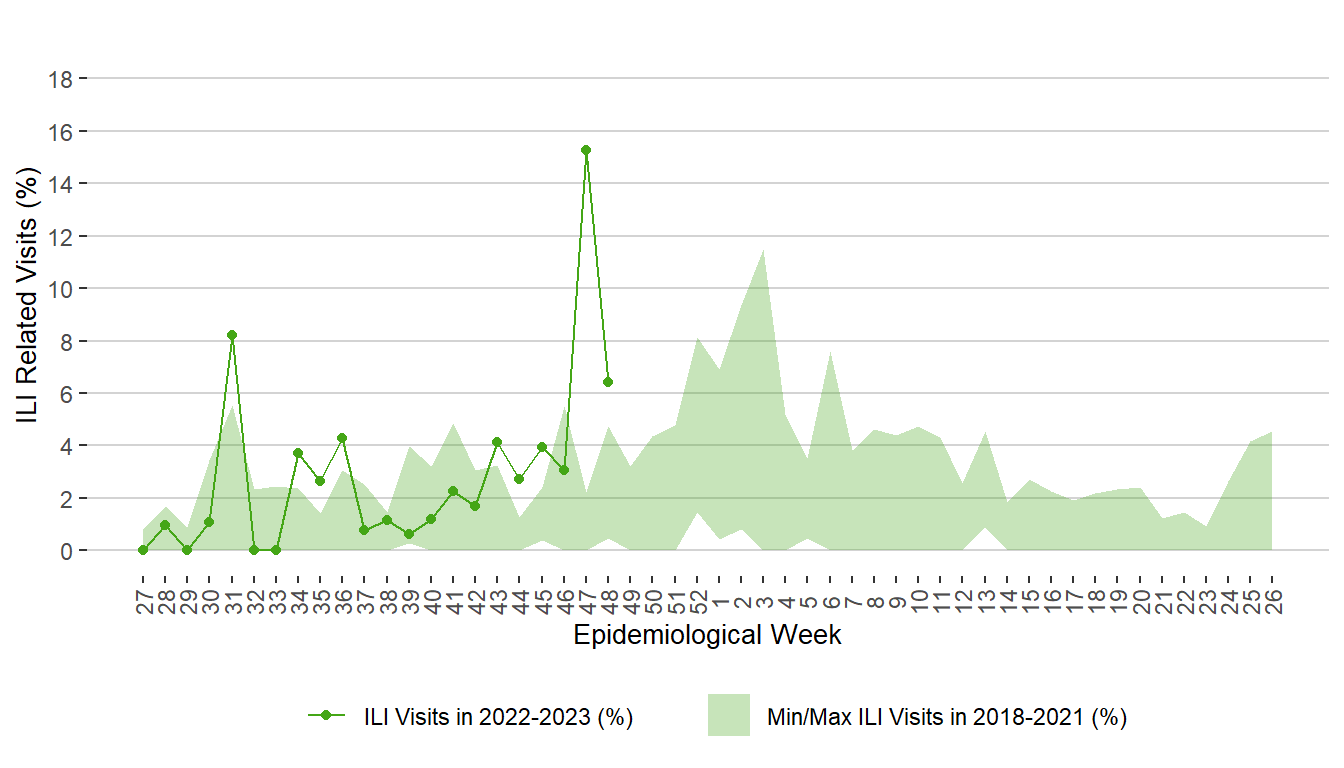
Physician Visits
Figure 17. Weekly Percentage of ILI Related Visits to Sentinel Physicians, Manitoba, 2018 – December 3, 2022
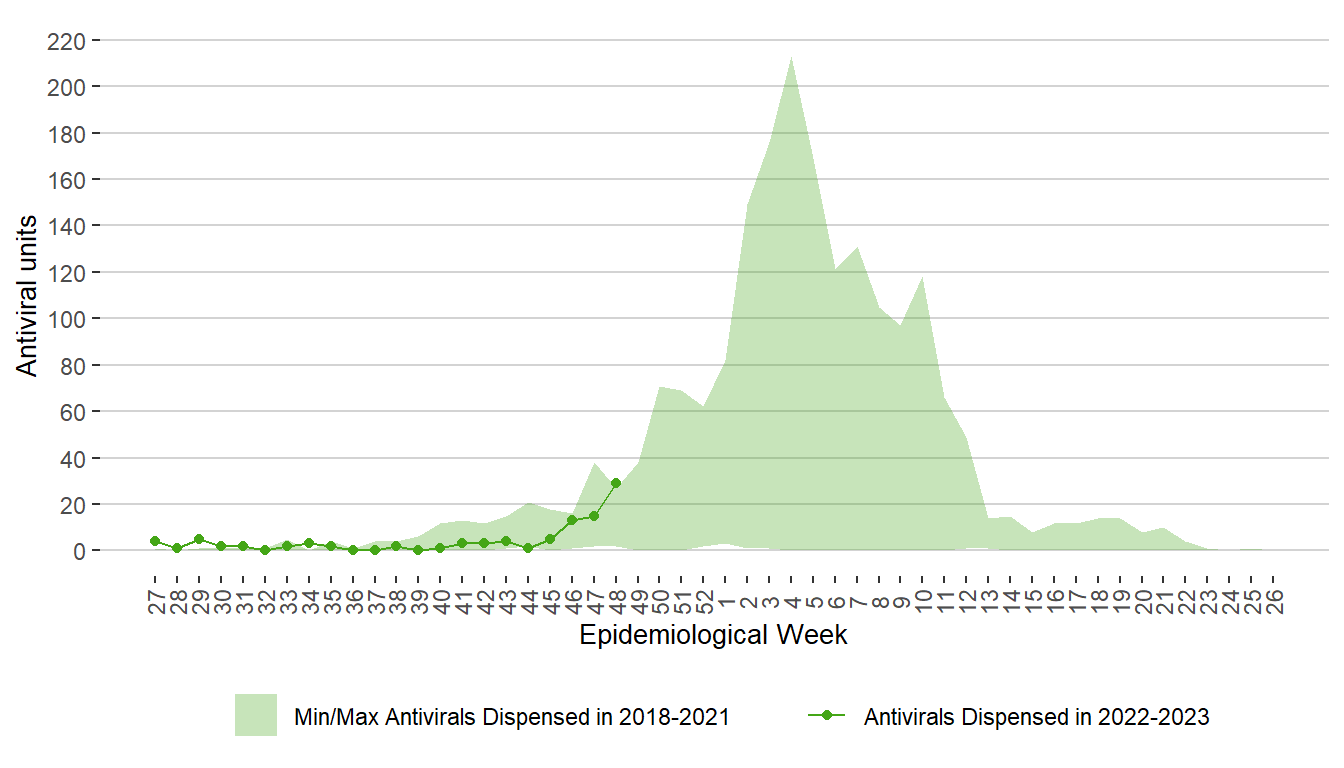
Antiviral
Figure 18. Weekly Units of Antiviral Dispensed from Pharmacies, Manitoba, 2018 – December 3, 2022
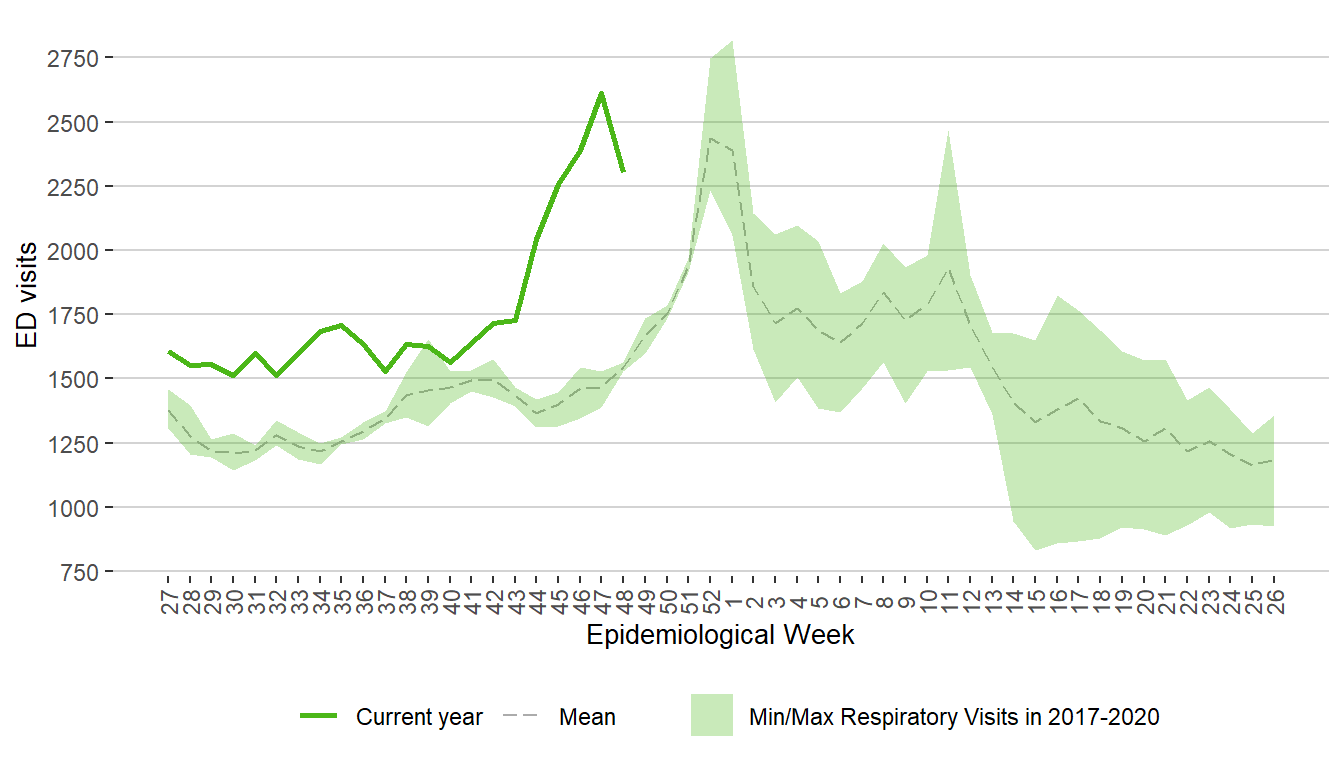
ED Visits
Figure 19. Weekly Respiratory Visits to Emergency Department, Manitoba, 2017 – December 3, 2022