
Medical and Hospital Services
Number of General Practitioners and Specialists
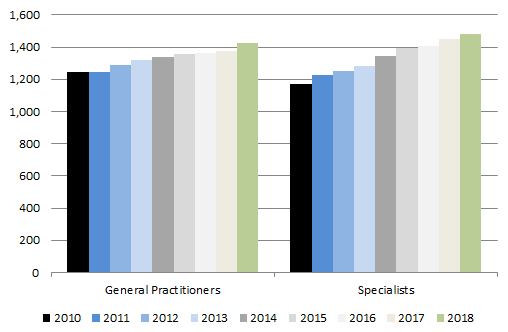
| 2010 | 2011 | 2012 | 2013 | 2014 | 2015 | 2016 | 2017 | 2018 | |||
| General Practitioners | 1,243 | 1,246 | 1,287 | 1,317 | 1,337 | 1,354 | 1,361 | 1,376 | 1,422 | ||
| Specialists | 1,172 | 1,226 | 1,251 | 1,282 | 1,345 | 1,394 | 1,407 | 1,448 | 1,480 | ||
Number of Nurses
Number of Registered Nurses (RNs), Licensed Practical Nurses (LPNs) and Registered Psychiatric Nurses (RPNs)
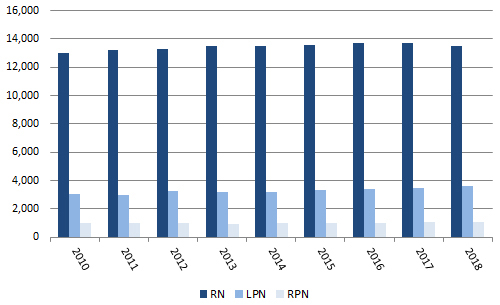
| 2010 | 2011 | 2012 | 2013 | 2014 | 2015 | 2016 | 2017 | 2018 | |||
| RN | 12,996 | 13,205 | 13,297 | 13,488 | 13,510 | 13,547 | 13,682 | 13,708 | 13,522 | ||
| LPN | 3,041 | 2,967 | 3,261 | 3,209 | 3,164 | 3,355 | 3,401 | 3,504 | 3,616 | ||
| RPN | 980 | 983 | 976 | 967 | 983 | 1,017 | 1,035 | 1,063 | 1,069 | ||
Number of Nurse Practitioners
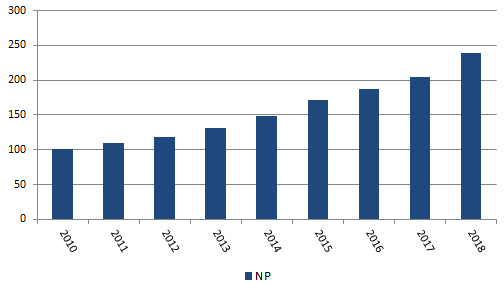
| 2010 | 2011 | 2012 | 2013 | 2014 | 2015 | 2016 | 2017 | 2018 | |||
| NP | 101 | 110 | 118 | 131 | 149 | 172 | 187 | 204 | 239 | ||
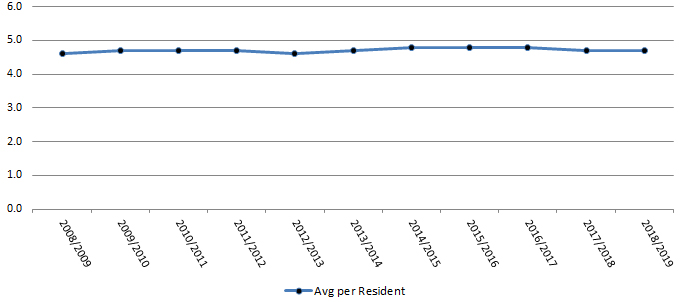
Ambulatory Care Visits
Average Number of Ambulatory Care Visits per Manitoba Resident
| 2009/ 2010 |
2010/ 2011 |
2011/ 2012 |
2012/ 2013 |
2013/ 2014 |
2014/ 2015 |
2015/ 2016 |
2016/ 2017 |
2017/ 2018 |
2018/ 2019 |
||
| Avg per Resident | 4.7 | 4.7 | 4.7 | 4.6 | 4.7 | 4.8 | 4.8 | 4.8 | 4.7 | 4.7 | |
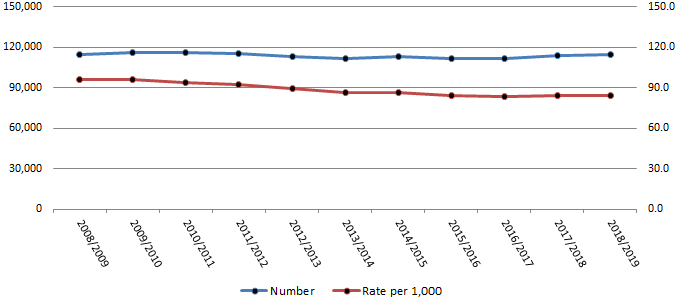
Inpatient Hospital Separations
Number and Rate per 1,000 of Hospital Inpatient Separations for Manitoba Residents
| 2009/ 2010 |
2010/ 2011 |
2011/ 2012 |
2012/ 2013 |
2013/ 2014 |
2014/ 2015 |
2015/ 2016 |
2016/ 2017 |
2017/ 2018 |
2018/ 2019 |
||
| Number | 116,281 | 115,790 | 115,264 | 113,251 | 111,314 | 112,768 | 111,312 | 111,911 | 114,062 | 114,272 | |
| Rate per 1,000 | 95.8 | 94.1 | 92.2 | 89.1 | 86.3 | 86.3 | 84.3 | 83.6 | 84.1 | 84.0 | |
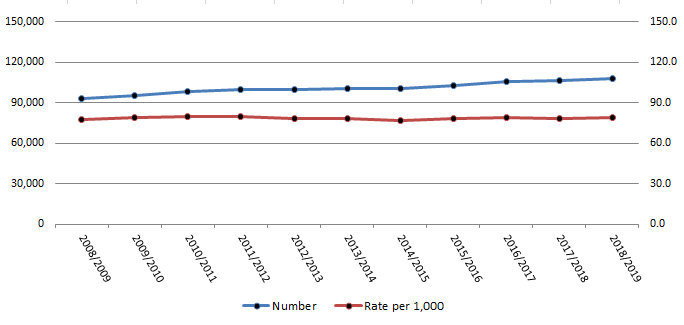
Day Surgery Hospitalizations
Number and Rate per 1,000 of Day Surgery Hospitalizations for Manitoba Residents
| 2009/ 2010 |
2010/ 2011 |
2011/ 2012 |
2012/ 2013 |
2013/ 2014 |
2014/ 2015 |
2015/ 2016 |
2016/ 2017 |
2017/ 2018 |
2018/ 2019 |
||
| Number | 95,515 | 98,552 | 100,099 | 99,406 | 100,757 | 100,462 | 102,899 | 105,770 | 106,520 | 107,778 | |
| Rate per 1,000 | 78.7 | 80.1 | 80.0 | 78.2 | 78.2 | 76.9 | 77.9 | 79.0 | 78.5 | 79.2 | |
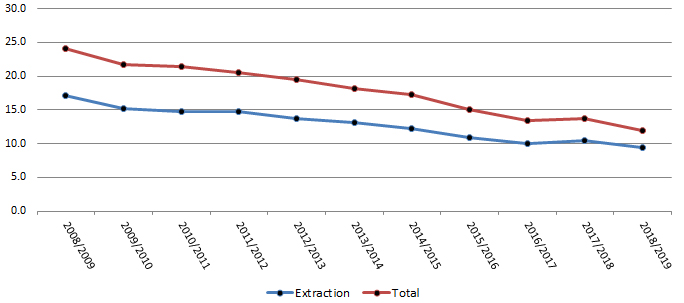
Pediatric Dental Surgeries
Rate of Pediatric Dental Extractions and Total Dental Surgeries per 1,000 Manitoba Children age 6 and younger
| 2009/ 2010 |
2010/ 2011 |
2011/ 2012 |
2012/ 2013 |
2013/ 2014 |
2014/ 2015 |
2015/ 2016 |
2016/ 2017 |
2017/ 2018 |
2018/ 2019 |
||
| Extraction | 15.2 | 14.8 | 14.8 | 13.8 | 13.1 | 12.2 | 10.9 | 10.0 | 10.4 | 9.4 | |
| Total | 21.7 | 21.4 | 20.6 | 19.5 | 18.2 | 17.3 | 15.1 | 13.5 | 13.7 | 12.0 | |
Any inquiries pertaining to these quick stats should be addressed to: Information Management & Analytics |