Heat Units for Potato Production in Manitoba
In recent years, potato production has become increasingly important to Manitoba's agricultural industry and to the provincial economy. The annual farm gate value of potatoes produced in Manitoba is more than $60 million. It's estimated that the benefit to the Manitoba economy through jobs in transportation, storage, equipment manufacture, and processing industries is about three times that amount. In 1996, Manitoba growers planted nearly 28,000 hectares (69,000 acres) of potatoes. in Canada, only Prince Edward Island plants more potatoes than Manitoba.
One reason for this industry's growth is the growing demand in Canada, the United States and elsewhere for table and processed potatoes. The popularity of potato chips and french fries has resulted in multi-million dollar expansions in the potato processing plants at Portage la Prairie and Carberry.
To make the most of the profit potential of this crop, different regions of Manitoba must be assessed for their suitability to grow potatoes. One of the most important considerations in this assessment of suitability is climate, and more specifically, temperature.
Temperature and Potato Growth
Only a small amount of data relating the stages of development of the potato plant to P-days accumulation is available at this time. This data has been summarized in Table 1.
Note that the data for Sebago and Kennebec are for P-days accumulation from emergence while those for Russet Burbank are from planting.
Crops need many things for good growth and maximum productivity- light, carbon dioxide, nutrients, water and a sufficiently long period without frost. What is often forgotten is that another requirement for growth and development of crops is needed - heat.
Each crop is very specific as to its heat requirements. The minimum temperature for potato growth and development is 7 'C (45 'F), while the most rapid growth and development takes place at 2l 'C (70 'F). The growth rate decreases with the increase in temperature and finally stops at 30 'C (86 'F). From this information, heat units for potatoes, called "P-Days" can be calculated. The relationship between P-days and temperature is shown graphically in Figure 2.
TABLE 1. Potato heat units required to reach each stage of development
| P-Days required by | ||||
| Developmental Progress | Sebago | Kennebec | Russet Burbank | |
0 |
50% emergence | 0 |
0 |
155 |
1 |
Tuber initiation | 118 |
130 |
330 |
2 |
Start of tuber growth | 236 |
260 |
440 |
3 |
Maximum bulking | 460 |
420 |
-- |
4 |
Cessation of bulking | 600 |
550 |
-- |
5 |
Tuber maturity | 850 |
-- |
approx. 1000 |
Effects of Rooting Depth and Ground Cover
Some studies have been done locally to examine the relationship between potato growth and development and P-days. Figure 3, for example, shows how the depth of root penetration depends upon accumulation of P-days. About 400 Pdays are required for roots to grow to a depth of about 40 cm (16 inches), and about 700 P-days must accumulate before roots reach their maximum depth of about 65 to 80 cm (25 to 31 inches). At a given point in time, the volume of soil from which the plant can extract water and nutrients can be estimated from P-days accumulation.
Figure 4 shows how the plant canopy grows with the accumulation of P-days. After about 450 P-days, there are enough leaves to completely cover the ground. Knowing the degree of ground cover is important because the greater the proportion of the ground covered with plant leaves, the greater the water requirement of the crop. Thus, P-days can be helpful in estimating the daily as well as seasonal water requirements of the crop.
The accumulation of heat useful to potatoes, P-days, is calculated from historical climatic data. It was assumed that potatoes were planted on the same date as wheat, thus historical wheat seeding dates from Statistics Canada were used. P-days were calculated from those planting dates to the date of the first fall frost. In these calculations, daily data for the period 1961 to 1990 from 65 weather stations in Manitoba were used. Because there is considerable year to year variation in useful heat accumulation, average, 75% and 90% probability values were calculated for each weather station.
Data from individual weather stations were used to prepare maps. To make it easier to find one's location, the boundaries of the rural municipalities have been added to the maps.
Regions Suitable for Potato Production
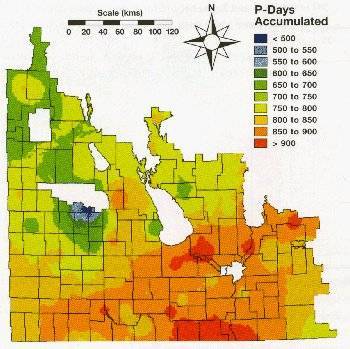
The highest average accumulation of P-days, 900 to 950, occurs in the very southern part of the Red River Valley in the municipalities of Franklin, Montcalm, Rhineland and Stanley, and a small area just to the east of Portage la Prairie. Most of the area to the south and east of a line from the southern end of Lake Manitoba to a point just to the east of the Manitoba Saskatchewan border has 850-900 average annual P-days. The remainder of the province has fewer than 850 P-days.
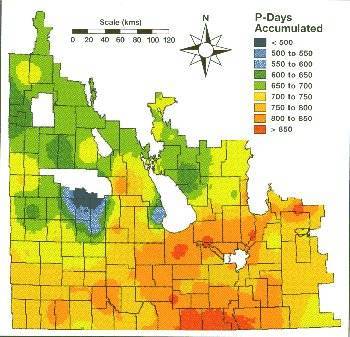
FIGURE 5. Annual Accumulation of P-Days for Manitoba - 75% Probability.
It is important to note that not all of the most southerly parts of the province have the highest P-day accumulations. For example, the area to the south and west of Melita does not have any more P-days than the area near Carberry, some distance to the north. In fact, it is elevation and not latitude that seems to be the most important factor influencing P-days. Going west from the Red River along the U.S. border, one finds areas of low P-days near Pilot Mound in the municipality of Louise and the Turtle Mountain region in the municipality of Morton.
Both of these are at higher elevation than areas nearby. At these locations, the fall frosts occur earlier, putting an end to the growing season, the date on which P-day calculations are stopped.
The effects of elevation can be seen even more dramatically in the Riding Mountain and Duck Mountain regions. These have very much lower P-days accumulations than areas to the east.
At the 75% probability level (three years out of four receiving at least this many P-days, only the municipalities of Montcalm, Rhineland and Stanley, and a small area around the city of Portage la Prairie receive 850-900 P-days. Otherwise, the relative distribution of P-days is the same as it was for the average. Most areas have about 65 fewer P-days at the 75% probability level than they have on average. The effects of elevation are again clearly illustrated.
At the 90% probability level (nine years out of ten receiving at least this many P-days, (Figure 6) again only the municipalities of Montcalm, Rhineland and Stanley, and a small area around the city of Portage la Prairie receive 800-850 P-days. otherwise, the relative distribution of P-days is the same as it was for the 75% map. Most areas have about 60 fewer P-days at the 95% probability level than they have at the 75% level.
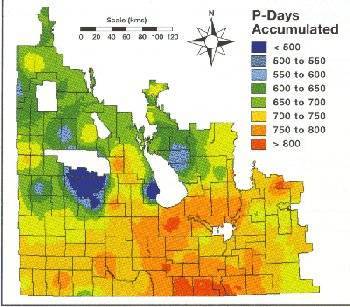
FIGURE 6. Annual Accumulation of P-Days for Manitoba - 90% Probability
The maps presented should be used with some caution. Some parts of the map may not be very reliable because they have few weather stations. For example, next to the Saskatchewan border there are 12 municipalities - Albert, Cameron, Whitewater, Pipestone, Sifton, Glenwood, Oaldand, Wallace, Woodworth, Whitehead, Daly, Archie and Nhniota - without a single weather station (Figure 7). P-days values in these areas have been estimated by interpolation of data from weather stations outside these municipalities. As a result, the map is not as reliable in this area as it is in areas with a higher weather station density. Other areas with low weather station density are in the southeast corner of the province, and in the area north of Dauphin-Grandview.
Another issue is the representativeness of weather data. This is particularly important when considering location near lakes or rivers. For example, the weather station at Great Falls on the Winnipeg River has a higher P-days accumulation than the surrounding area. This is likely the result of a longer frost-free period recorded at that particular weather station. Although there is no question about the accuracy of the observations made at the weather station, the data may not be representative of the surrounding area because the influence of the river on the weather may extend for only a short distance from the river. As a result, the map probably overestimates the thermal suitability for potato production in that area.
It should be remembered that the data presented here deal with only one aspect, the suitability of the temperature regime for potato production. Many other factors need to be considered, such as the growing season precipitation, the soil's texture and water holding capacity, suitability for irrigation, soil salinity, and stoniness. In addition to the temperature regime, growers need to consider all these aspects before going into commercial potato production.
For further information, contact your local MAFRI GO Office.
This information was prepared by Dr. Carl Shaykewich and David Blatta, Department of Soil Science, University of Manitoba.